


Illustration: What are the most popular trading indicators?
There are many trading indicators out there and you will certainly find one to suit your needs and your trading or investment profile. Some of these indicators are, however, more popular than others and favoured on a daily basis by many traders. These are the “can’t-do-without”, simple-to-use indicators you need to get a handle on.
Moving averages
Moving averages smooth out price fluctuations into a single flowing line. This line represents the average price over a given period of time. Investors and traders who tend to follow long-term trends often favour single moving averages of 200, 100 and 50 days. It is important to understand that these averages are over « periods of time »”, which can be days, hours or even minutes, depending on the time unit on the price chart concerned.
There are several ways to utilize the moving average. The first is to look at the angle of the moving average. If it is mostly moving horizontally for an extended amount of time, then the price isn't trending, it is ranging (fluctuating between two points). If the line is angled, then the price is either in an uptrend or a downtrend. Whatever the trend, moving averages do not predict, they simply show what the price is doing, on average, over a period of time.
Horizontal moving average ( Click on the image to enlarge )
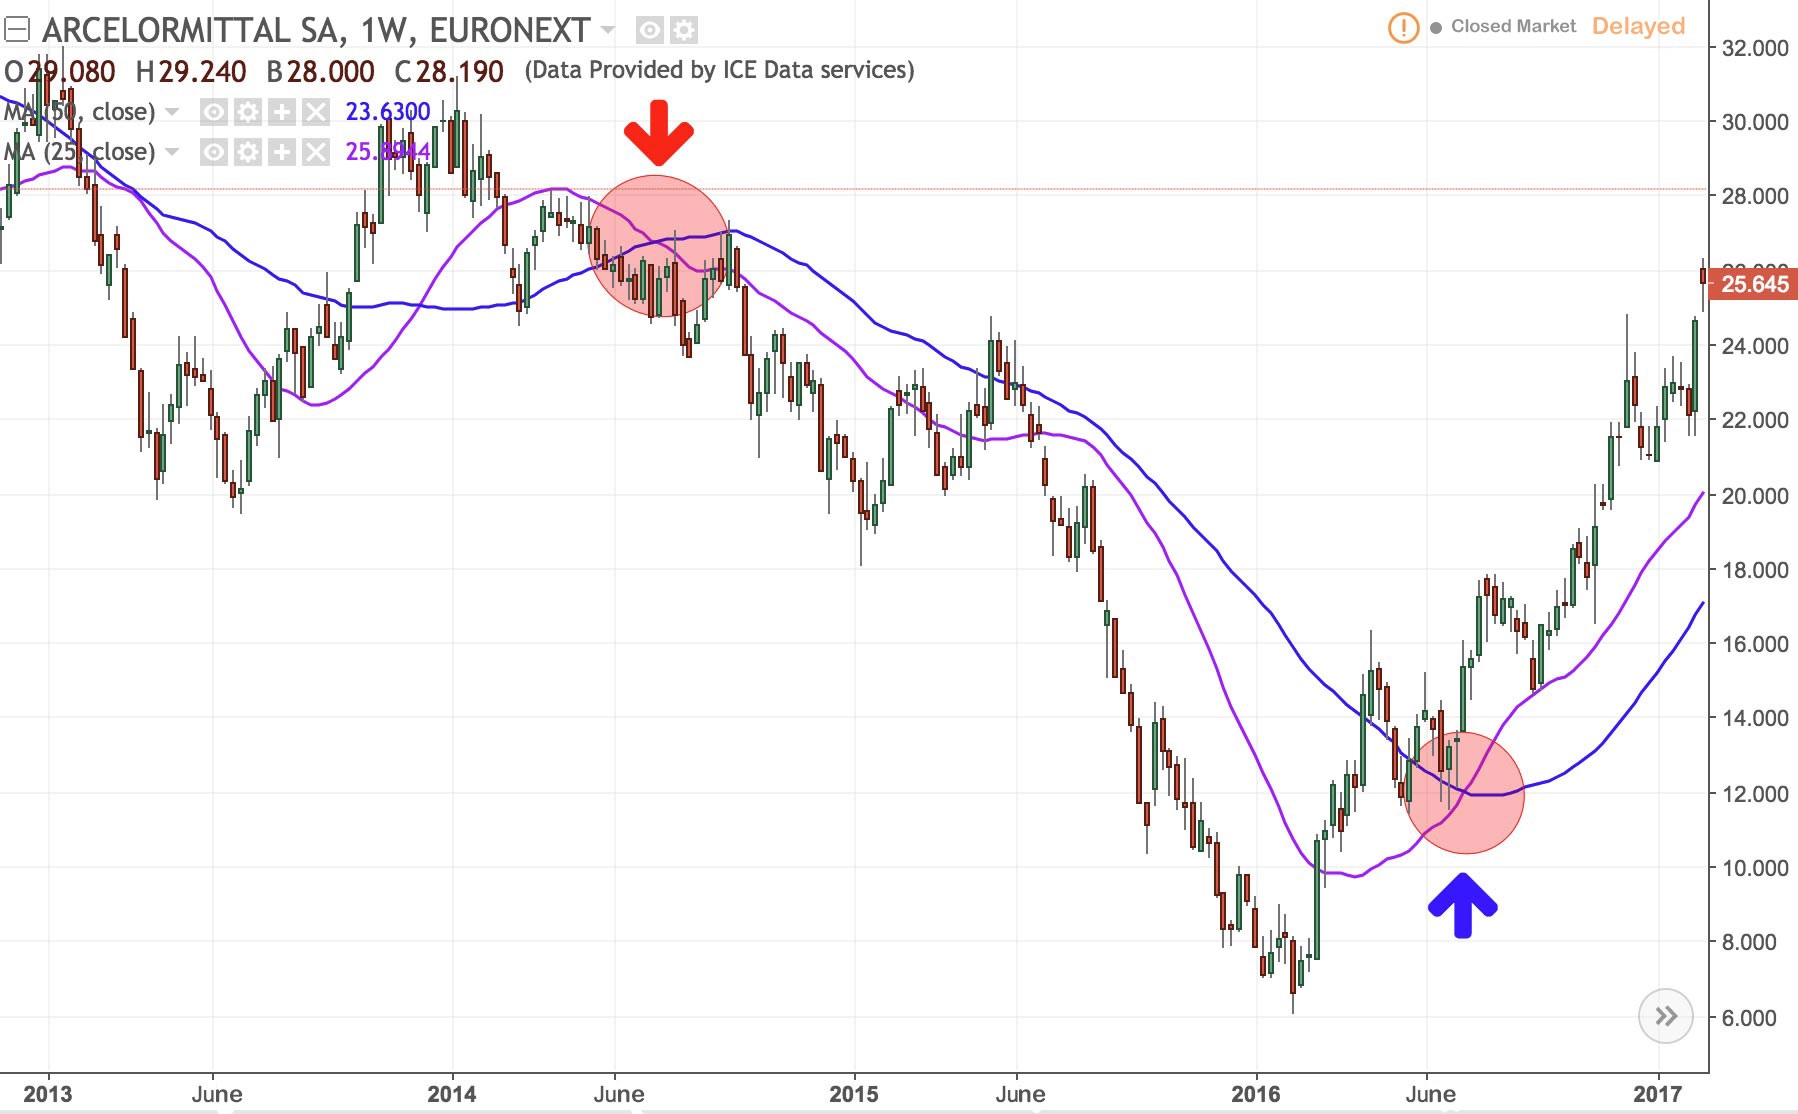
Another way to use moving averages is to keep an eye on when two moving averages cross over. By tracing a 25-day and a 50-day moving average, for example, the 25-day simple moving average breaking above the 50-day line signals a buy opportunity. The 25-day line crossing below the 50-day line signals a sell opportunity.
Buy and sell signals ( Click on the image to enlarge )
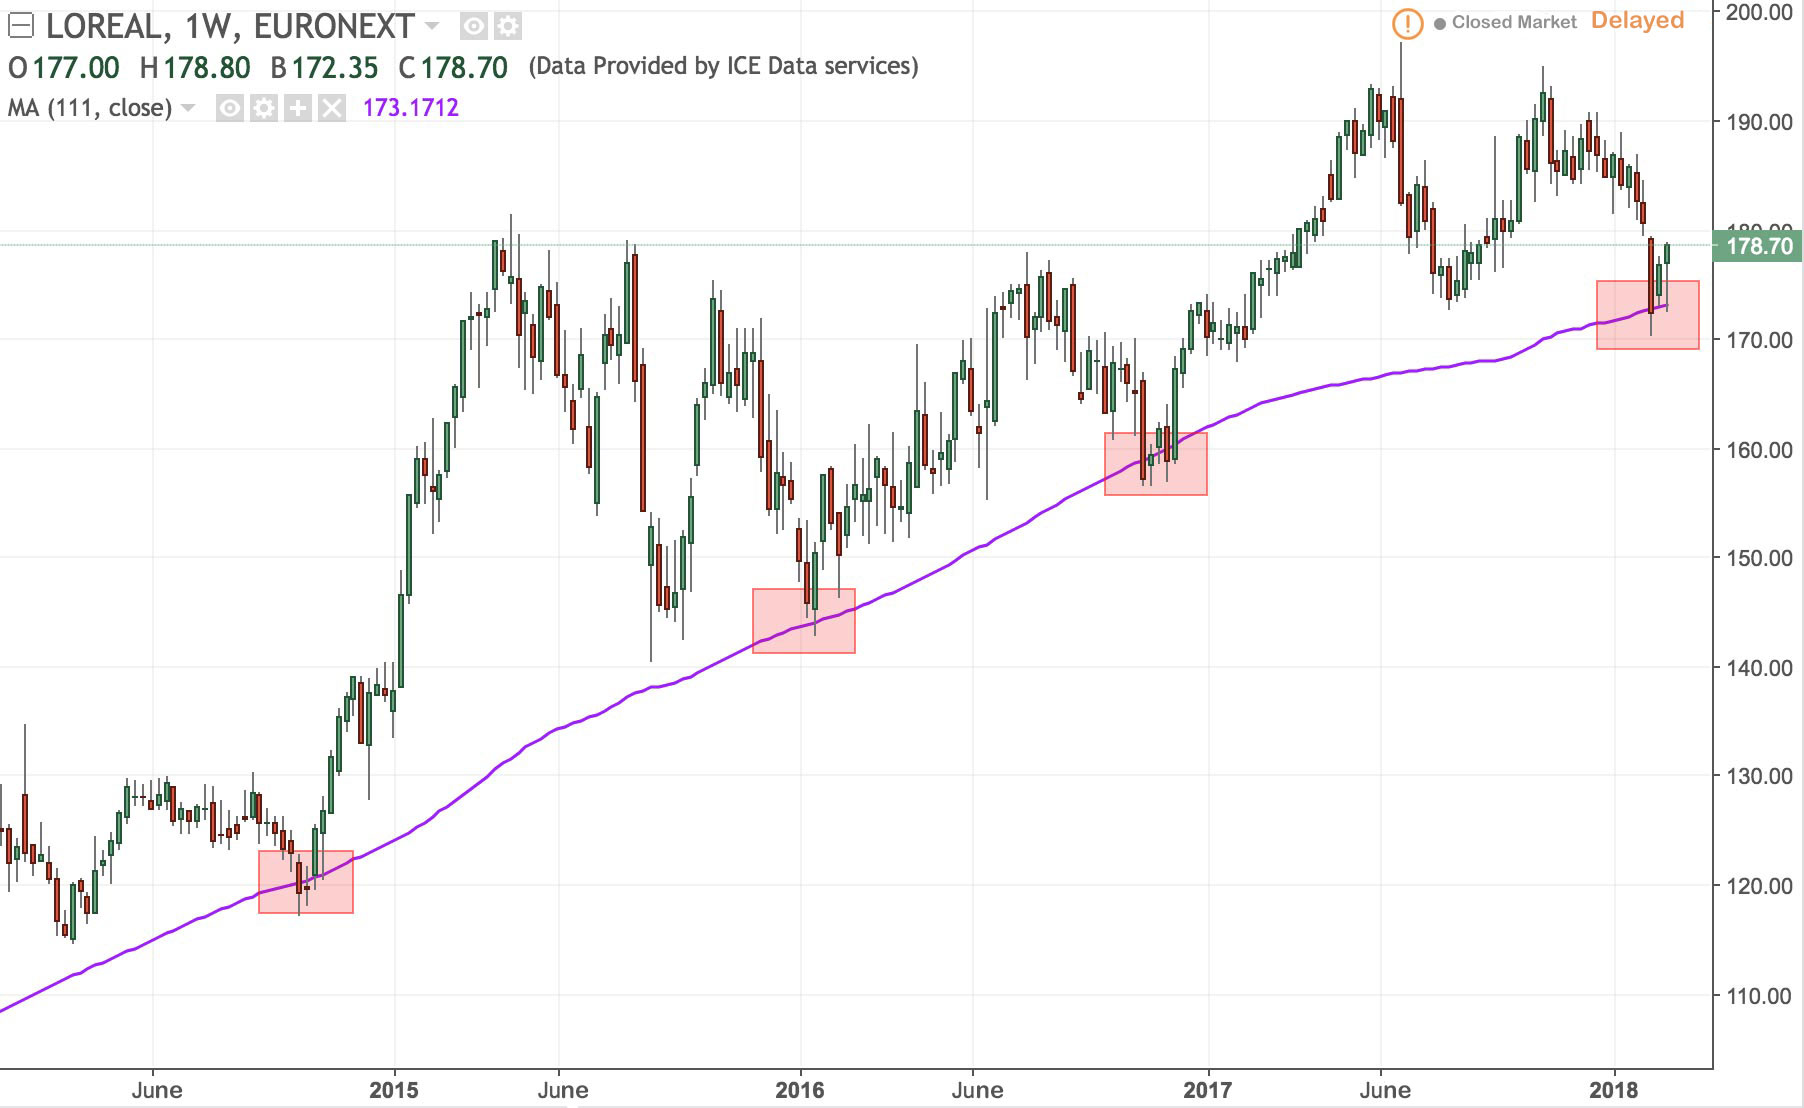
When the price crosses above a single moving average, it can also be used as a buy signal, and when the price crosses below a moving average, it can be used as a sell signal. Since price is more volatile than the moving average, this method is prone to more false signals, as the chart above shows.
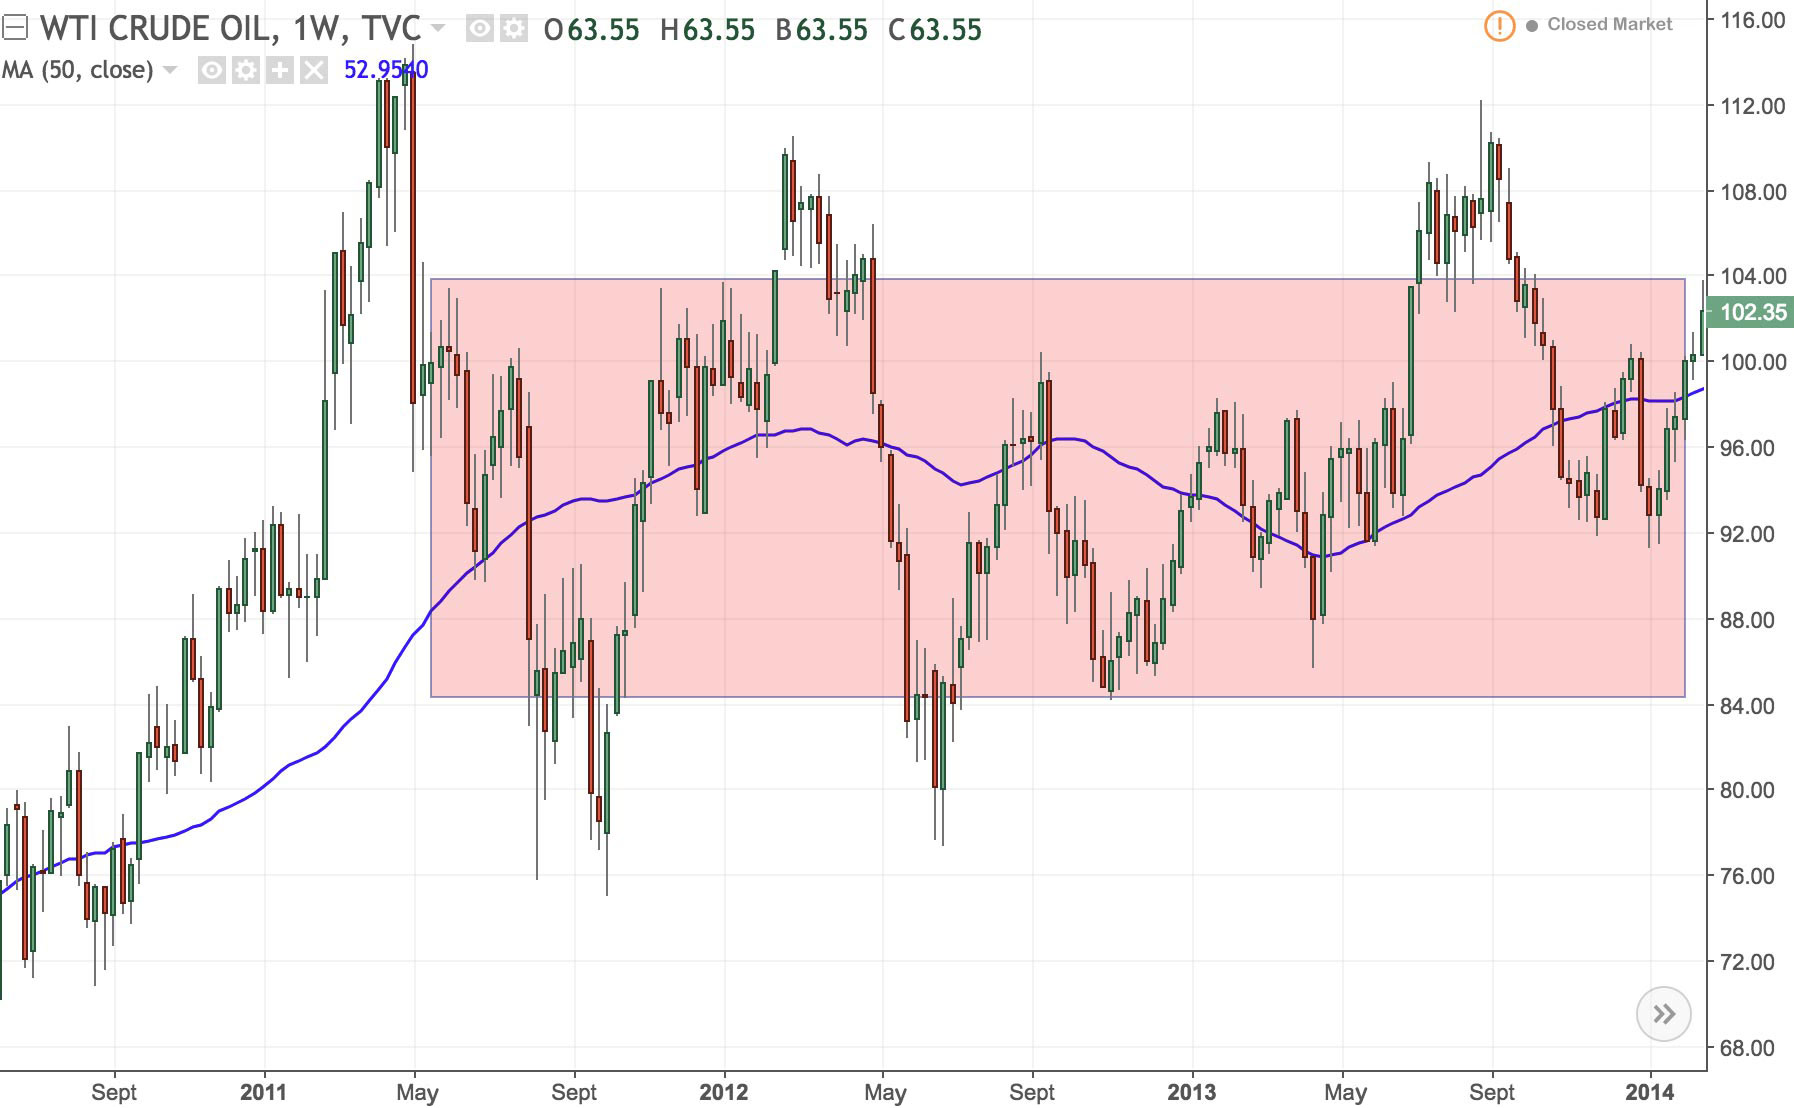
Finally, moving averages can also provide support or resistance to the price. The chart below shows a moving average acting as support level (meaning the price bounces off it).
RSI
RSI (Relative Strength Index) is a momentum oscillator that measures the speed and range of price movements or trends. It is used to evaluate trends over a chosen period of time and is often more accurate on longer periods such as days or weeks. Using these periods often avoids false signals.
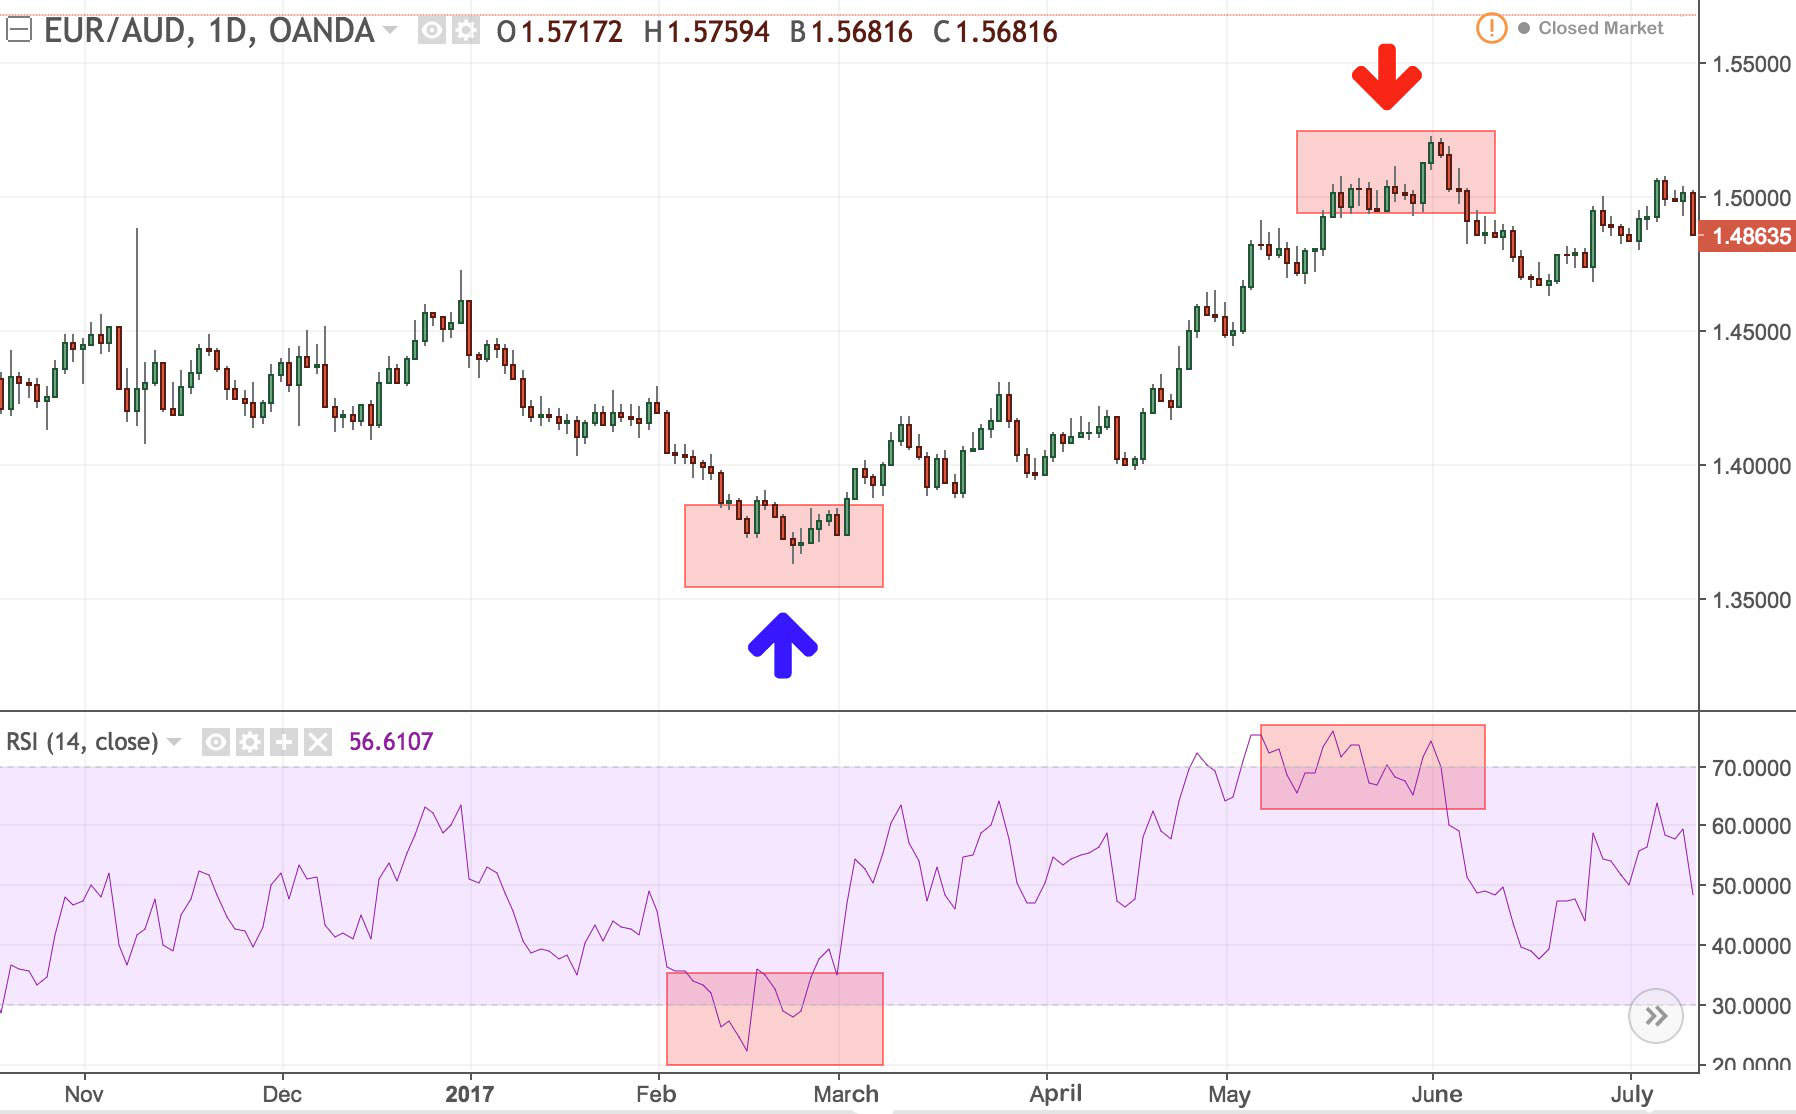
One way to use the RSI is as a signal for overbought or oversold situations for a given asset. The RSI oscillates between 0 and 100. Traditionally, the market is considered overbought when the RSI exceeds 70, and a market is oversold when it drops below 30. When the RSI goes over or under 50 a downtrend or uptrend can be observed. It follows that an RSI under 50 is a sign of a falling (bear) market and one above 50 indicates a rising (bull) market.
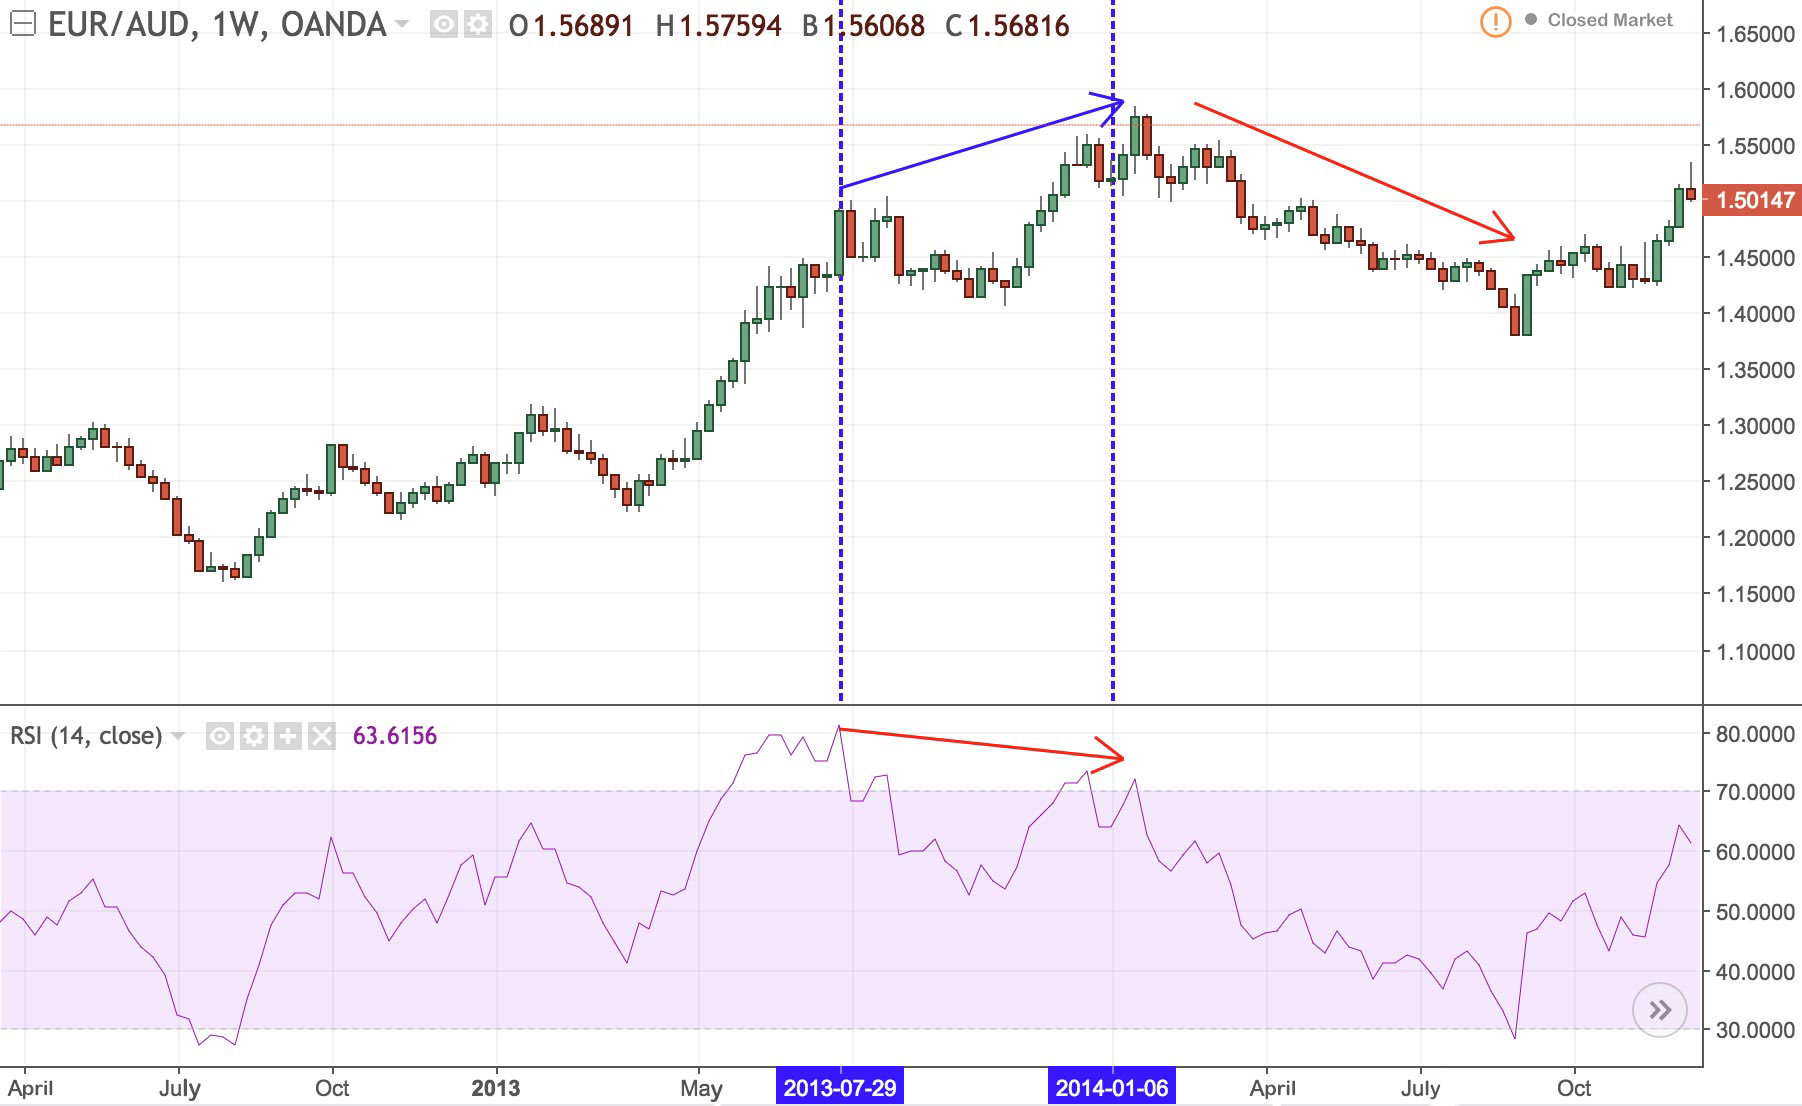
Another way to use this indicator is with divergence. Divergence tends to highlight when a rising or falling market is slowing down, and so a reversal is on the cards. When the market price has hit two highs, and the second is higher than the first, and at the same time the RSI hits a second higher that is lower than the first, we have a bearish or negative divergence. There are several different configurations but in general there is divergence when the RSI and market price are performing differently.
MACD
The MACD « Moving Average Convergence Divergence », is probably the most popular technical indicator in trading. It not only indicates a trend but also the momentum of a product. What the MACD does is compare the long-term and short-term performance of a price in order to predict its likely future direction. It is, in fact, a comparison between two moving averages which you can set for whatever time period you choose, although 12- and 26-day averages are the norm. The short-term line crossing the long-term line signals a trend reversal. When the short-term line is below the long-term line, and then crosses above it, the stock it describes will generally continue to rise. It follows that a fall in the market can be expected when the short-term line crosses the long-term line downwards.
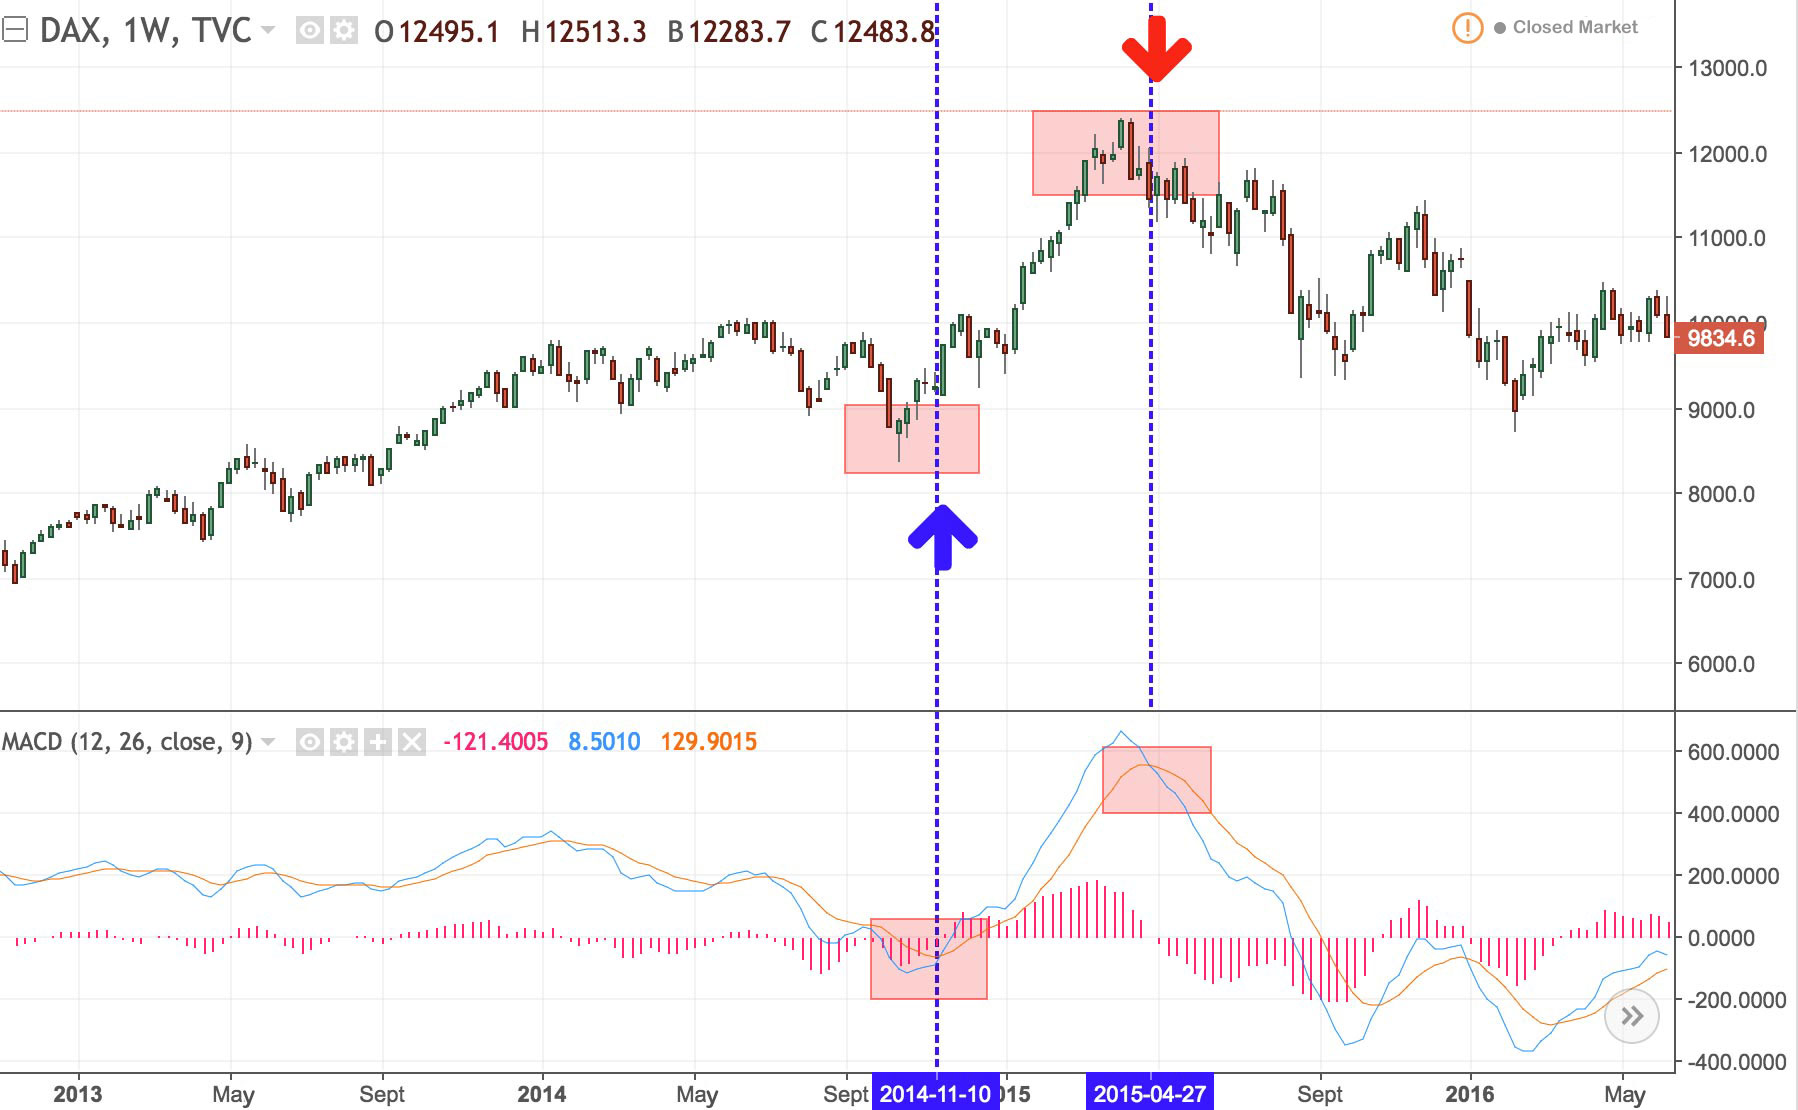
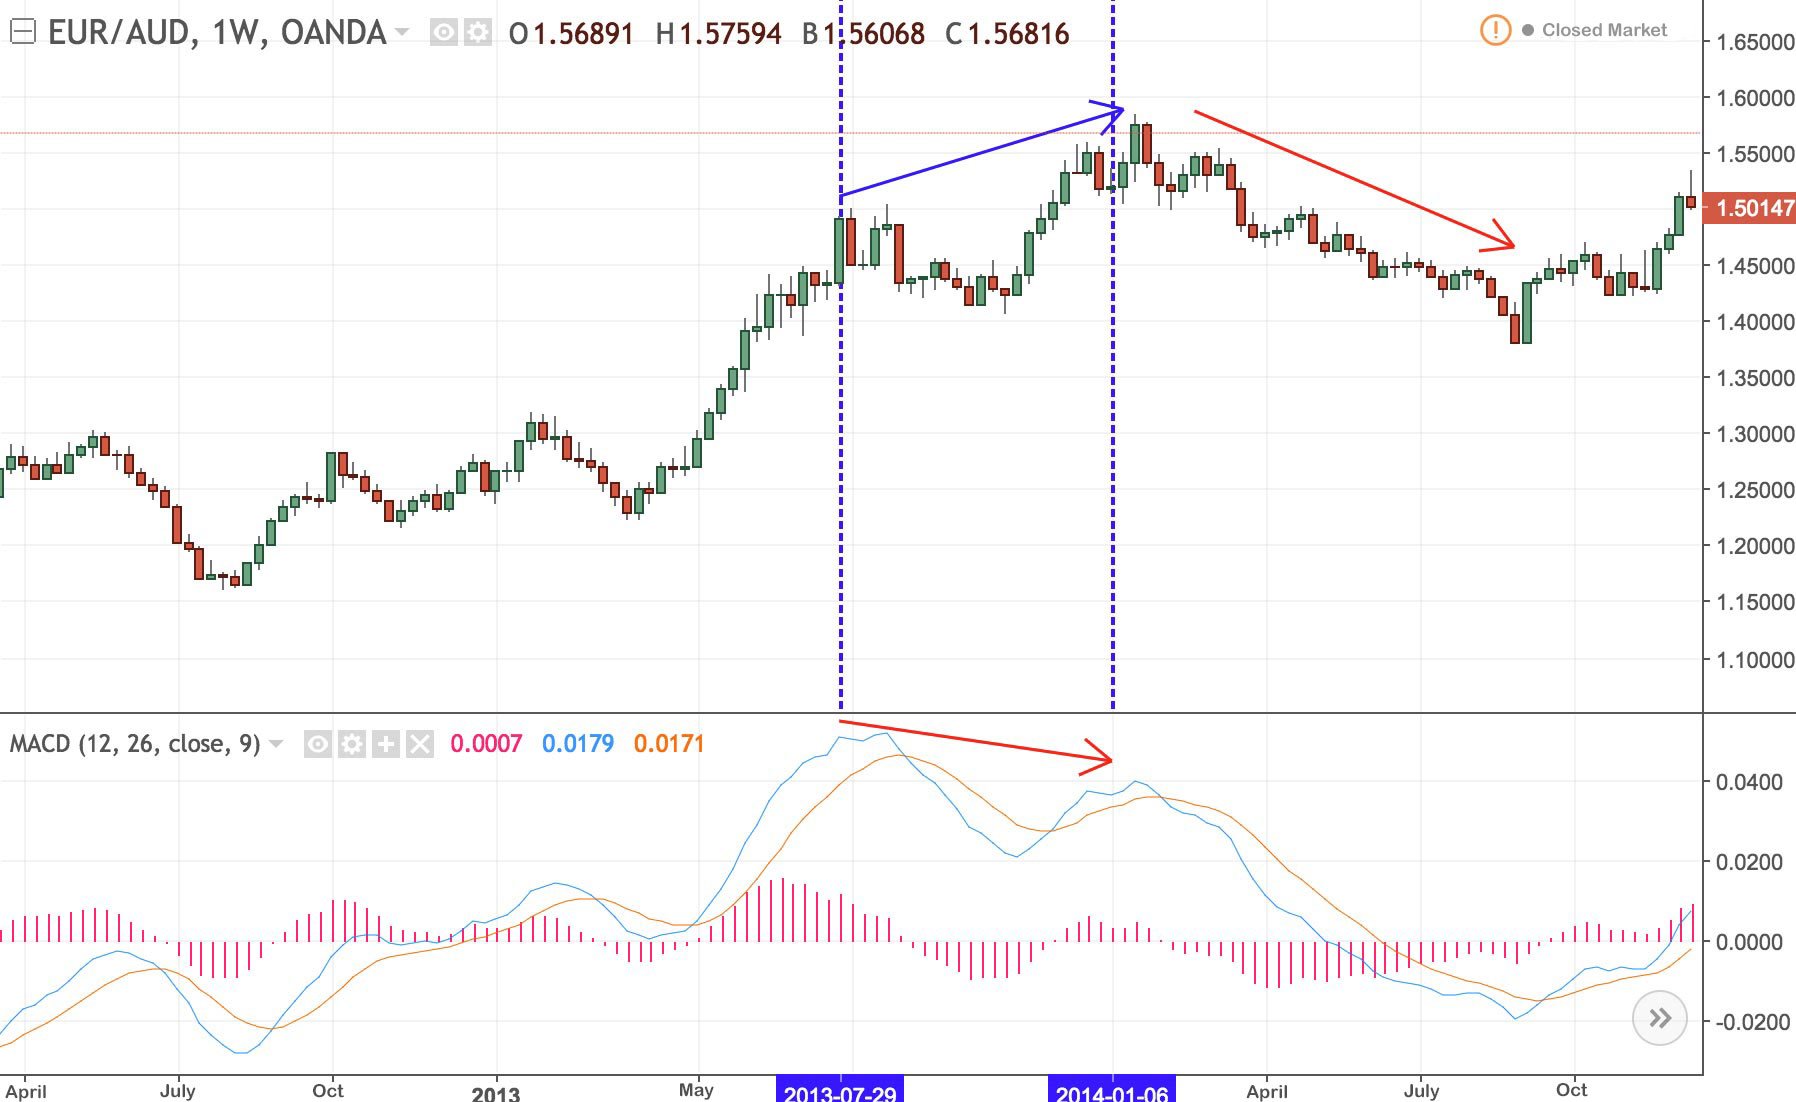
Just like with the RSI, divergence can also be used with the MACD.
These three indicators are much used to analyse prices and can be used together to confirm trends or reversals. It is important to understand that the indicators are just that, indicators, and as such, are not perfect, and false signals are a frequent occurrence.


