


Illustration: What is RSI ?
There are dozens of methods, strategies, and technical indicators to inspire traders and help them identify entry and exit points, and evaluate the state of the market over various periods of time. The RSI is amongst the best known and the most often used.
What is the RSI ?
The RSI (Relative Strength Index) is a technical indicator of momentum. The acronym stands for Relative Strength Index. Its main value is as a signal of over-bought or over-sold situations for a given asset. In technical terms, it compares the range of recent profits or losses over a given period of time to measure the speed and changes in the movements of the price of a security.
Most trading platforms automatically offer this indicator which completes the graph of any asset (currency pairs, shares, commodities...)
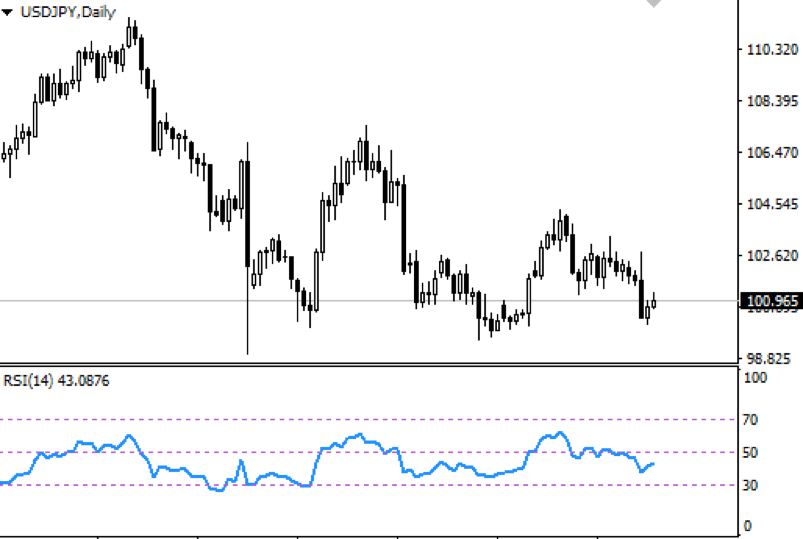
The RSI oscillates between 0 and 100, usually over a time frame of 14 days: on a graph it appears as RSI(14). This duration can obviously be reduced or extended to visualise the RSI over different lengths of time.
How can you use the RSI ?
Two levels usually help give signals of entry or exit:
If the RSI is above or equal to 70, the market is over-bought or over-priced, you should not buy as a fall in prices or a trend reversal are likely.
If the RSI is below or equal to 30, the market is over-sold or under-priced, you should not sell as the market will probably pick up.
At the same time, when you want to confirm a market trend, you look for an RSI of 50. This is because in a bear market an RSI falling below 50 confirms the general trend. The same applies to a bull market when the RSI rises above 50.
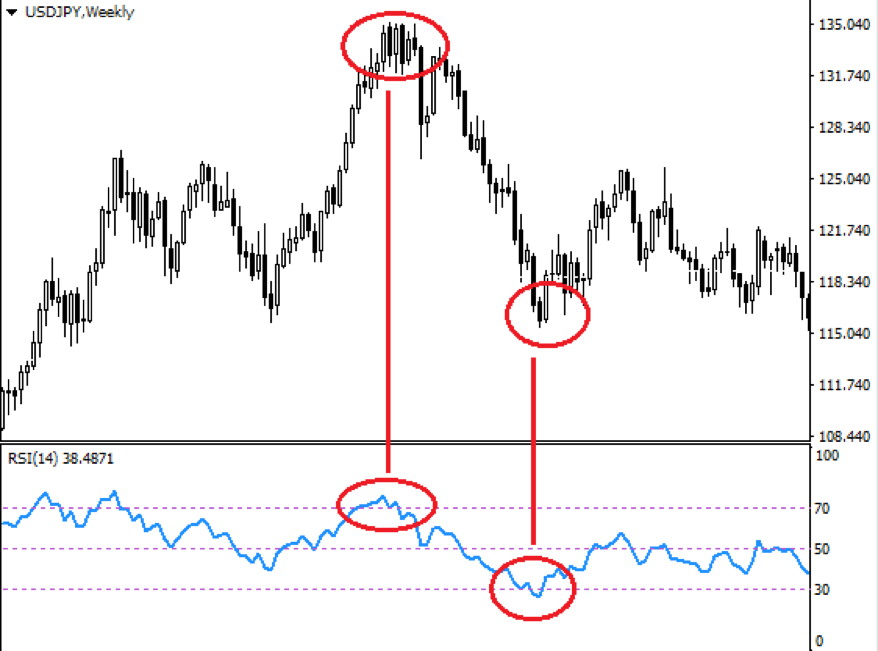
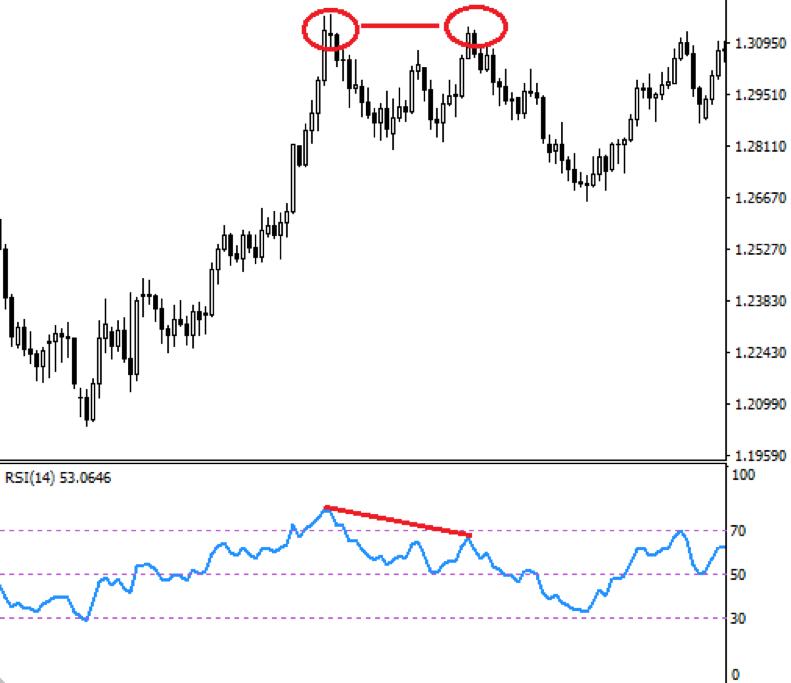
Another, more subtle, way to use the RSI is by identifying a decorrelation between the RSI and market prices: this is known as a divergence.
Example: the market reaches two successive highs, with the second being at least as high as the first; at the same time, the RSI reaches two successive highs as well, but with the second lower than the first. This means the market is slowing down and a price reversal is imminent. This is known as a bearish or negative divergence.
The same rule applies to 2 lows, pointing to a likely price recovery. This is called a bullish divergence: the market reaches a new low, while the RSI is higher.
Limits
Although very user-friendly, the RSI can give incorrect signals. Indeed, in a bear market, the RSI sometimes remains below 30 for a certain time, and in a bull market as well, the RSI can exceed 70 for a certain time. This makes it difficult to identify when the market is truly over-bought or over-sold and to predict trend reversals. To alleviate this uncertainty traders do not use 30 and 70 as their limits, but 25 and 75, or even 20 and 80. At these levels it is more likely that the market is indeed over-bought or over-sold.
In any case you must always use other indicators or graphics to confirm buy and sell signals when using the RSI.
Summary
Remember that the RSI is not a magic wand and does not work perfectly. So always combine it with other strategies.
Also take into account the fact that divergences are not exclusive to the RSI. They can be used with other technical indicators to confirm or invalidate signals.


