

The first impulse of any trader who wants to invest is to check markets rates fluctuations visually, in order to find inspiration. Support and resistance are amongst the best known configurations to identify and they are easy to recognise and popular with many traders.
What is a support ?
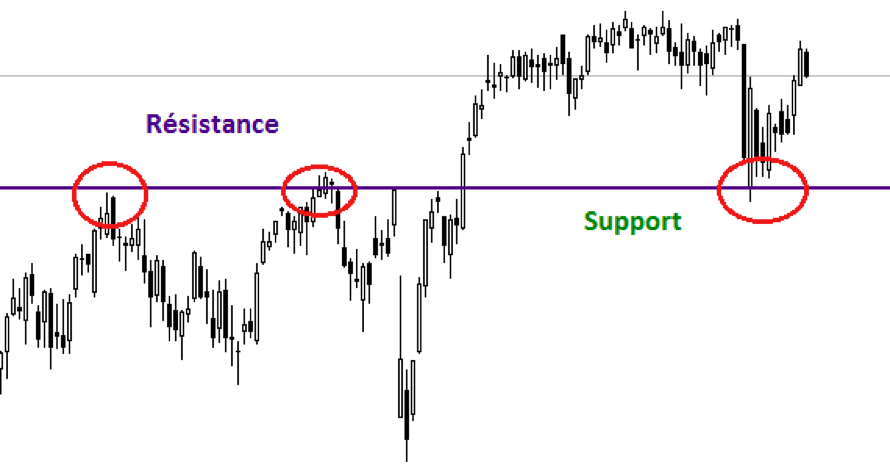
A support appears when at least two low points of a curve occur at the same level or in the same area. Consequently, when the market is higher and trends downwards once more, you can expect that it will bounce up again from the same level observed before. The more often this support is tested, the stronger and harder to break it becomes. At the same time, the longer the period when this pattern is noted on the graph, the stronger the support: for example a support on a monthly graph is stronger than a support on a daily graph.
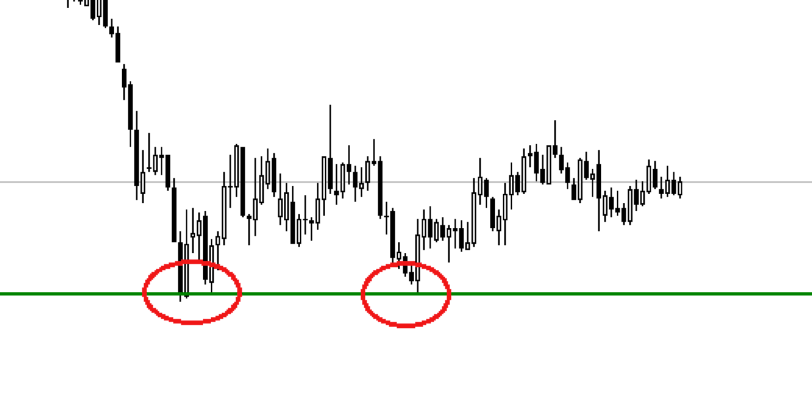
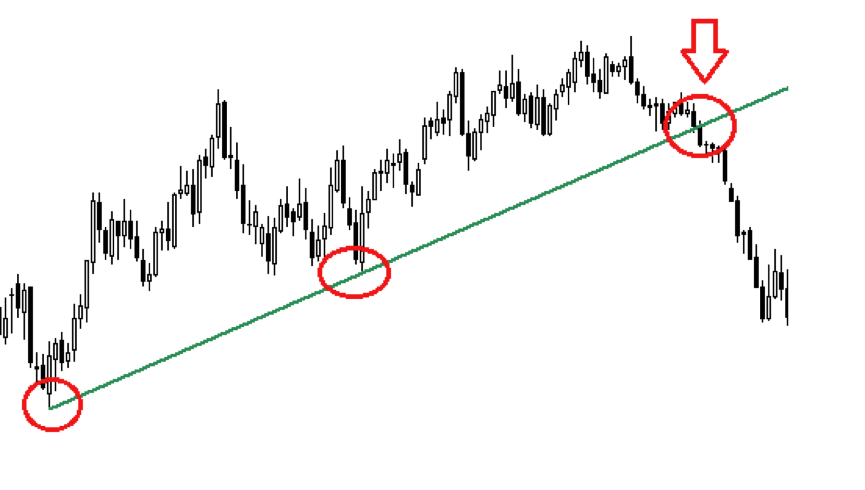
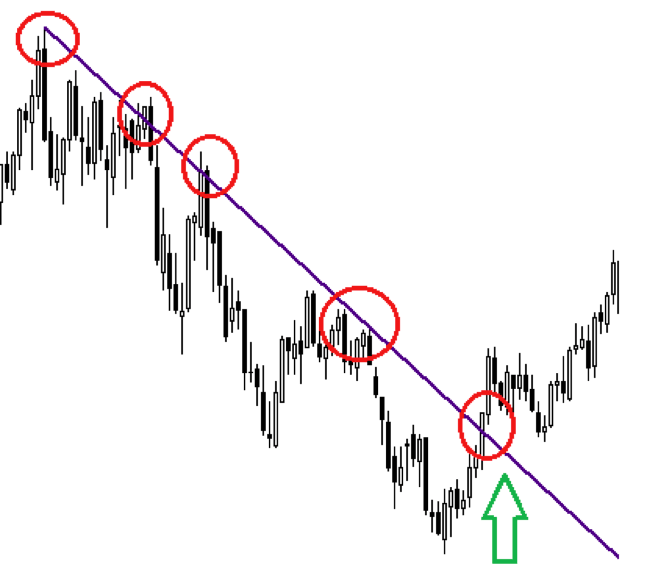
In this example, the support is horizontal, on one level. It can also have an upward or downward slope: this type of support is frequent in upward or downward channels.
Bullish support example:
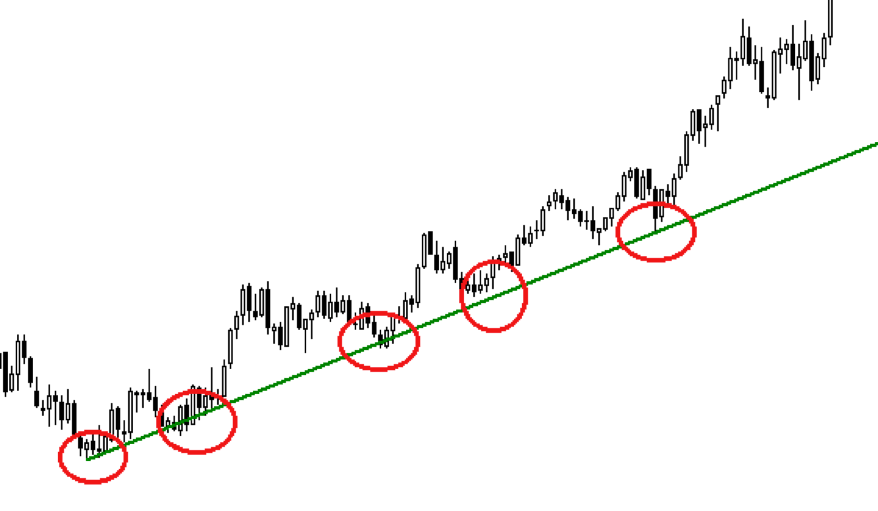
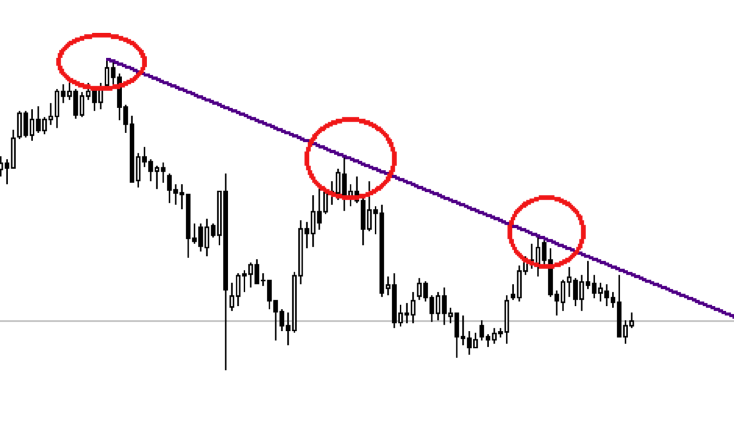
Bearish support example:
What is a resistance ?
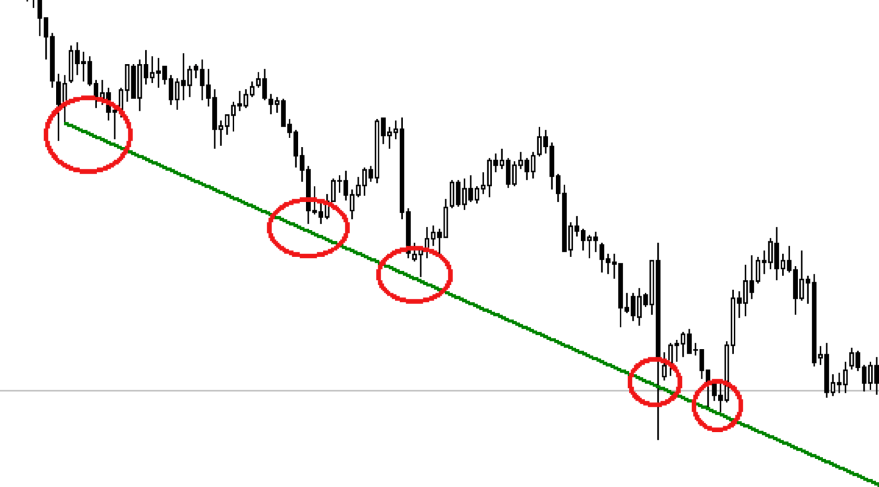
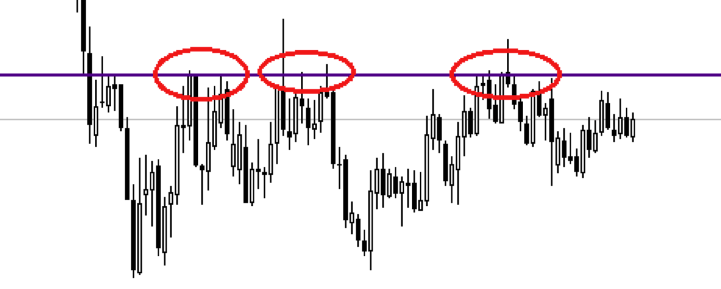
A resistance is the mirror image of a support. Instead of looking at the low points, we are now considering the high points which can only be broken through with difficulty. A resistance appears when at least two high points are observed, which can be at the same level or not.
Horizontal resistance example:
Resistance on a bearish market:
How to use support and resistance ?
Supports and resistances tend to appear whether the market is trending upwards or downwards, and each will be a potential point of entry or exit. In an uncertain market environment with no clear direction, the best strategy is to buy at support level and sell at resistance level. In the same way, when the market is bullish but oscillating, a frequent occurrence, you can buy at support. Conversely, if the market is bearish, you will want to sell at the highest price, hence at resistance.
When a support or a resistance stops being valid, it is time to act: take a position, limit your losses, cash in on your profits. This is called a breakout. The areas immediately above a resistance often become targets for profit or stop-loss. Areas immediately below a support are interesting action zones for the same reasons.
Examples:
- The market breaks through a support (downward): it is time to sell. You can choose to short-sell, or to cut a long position.
- The market breaks through a resistance (upward): it is time to buy. You can buy, or cut a short position.
At the same time, when a support is broken through, it tends to become a resistance. Likewise, when the market breaks through a resistance, that level turns into a support.
Pros and cons
These patterns are easily observed and visually prominent. They work on any market and any graph.
However, supports and resistances never last indefinitely. Your aim is thus to identify disruptions and ends of trends, as a seemingly long-term support may well not be valid anymore when you consider a potentially good transaction. You can never be sure. Hence, relying solely on these levels to develop a strategy can be risky.
You must also very carefully consider the time frames in question. They are key to determining a level's strength.
Lastly, support and resistance levels are never very accurate. They are usually relatively undefined areas. This means you can never be quite sure whether a certain level has been reached, broken through, exceeded, etc. Finding ideal entry and exit points with this method is impossible. You can only estimate the right levels.


