

Illustration: How to use the MACD?
The MACD - Moving Average Convergence Divergence - like the RSI, is a prominent technical indicator for trading on the stock exchange.
It is visually very user-friendly and works as a momentum indicator, pointing to trends and various trading signals. However, the MACD cannot indicate overbought or oversold levels as it is limited by neither ceiling nor floor.
The MACD indicator is available on most trading platforms, whether they are offered by brokers or other graph-based websites.
What is the MACD ?
MACD works by following two lines : the MACD itself and a signal line. The name Moving Average Convergence Divergence means it represents moving averages, and is designed to make trends and trading signals easy to apprehend.
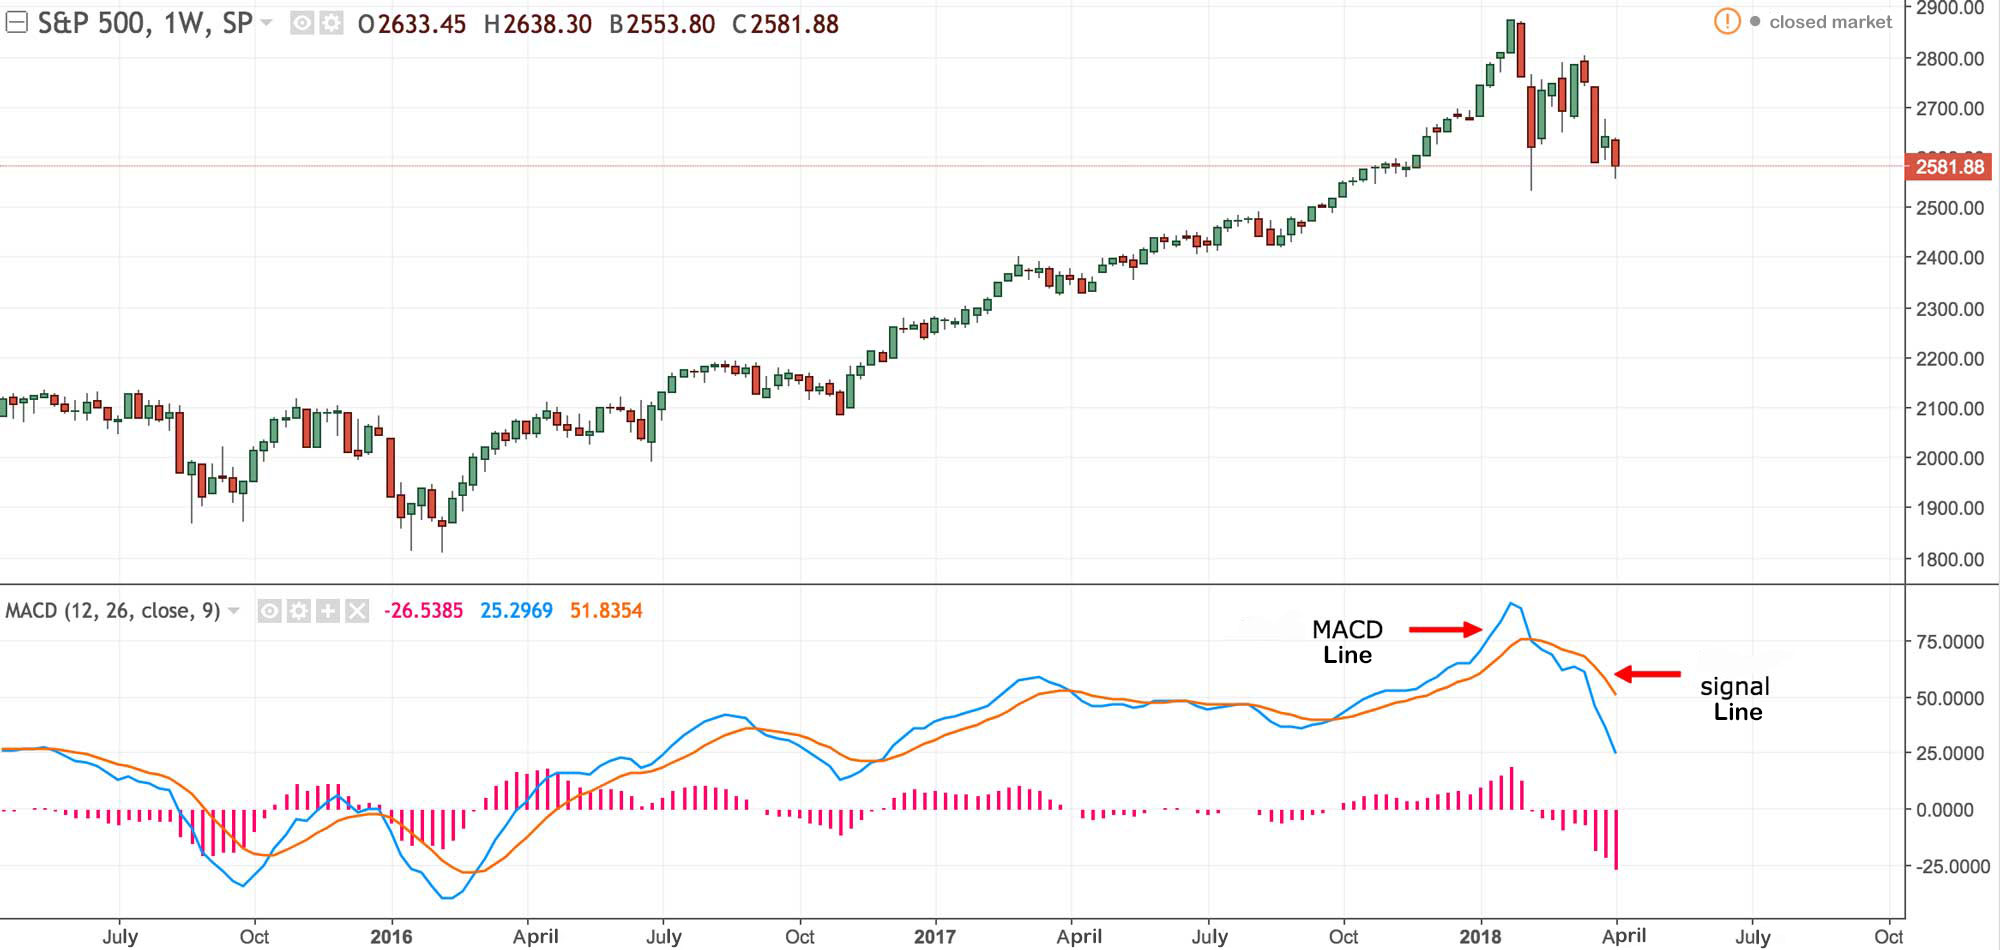
The (blue) MACD line shows the difference between the EMAs (exponential moving averages) in a slow or long period and in a fast or short period. 12 and 26 are the usual references for fast and slow periods. Data is updated within the parameters of the MACD indicator.

The (orange) signal line represents the EMA for the MACD series. The (pink) histogram on the bottom chart is a graphic representation of the divergence between MACD and signal lines : if the MACD line is above the signal line, the histogram is said to be « positive », whereas, if the MACD line is below the signal line, the histogram is said to be « negative ».
How can you use the MACD
Tracking global trends
First of all, the MACD is a useful tool when you seek to confirm a market trend whether bullish or bearish. A positive histogram (MACD above signal line) shows an upward trend. Conversely, a negative histogram (signal line above MACD) reveals a downward trend. Factors such as the chosen time unit (daily, hourly, etc) obviously play a role. To track a long-term trend you need to parse results based on timeframes of at least 24 hours and up to a week.
Crossover
Intersections between MACD and signal lines may indicate buy or sell signals. A MACD line which crosses above (bullish crossover) its signal line means you should buy. A MACD line crossing its signal line downwards (bearish crossover) means you should sell.
Please note that in both cases the histogram reaches zero at the point of intersection which makes it easy to track these signals.
It is important to analyse the global market context in any case, as things can get complicated and false signals are frequent.
Zero Crossover
As previously described, when the histogram crosses the horizontal axis it is easy to visualize when to buy or sell and to confirm trends. It can also help detect a slowing down or indeed the end of a trend (trend reversal).
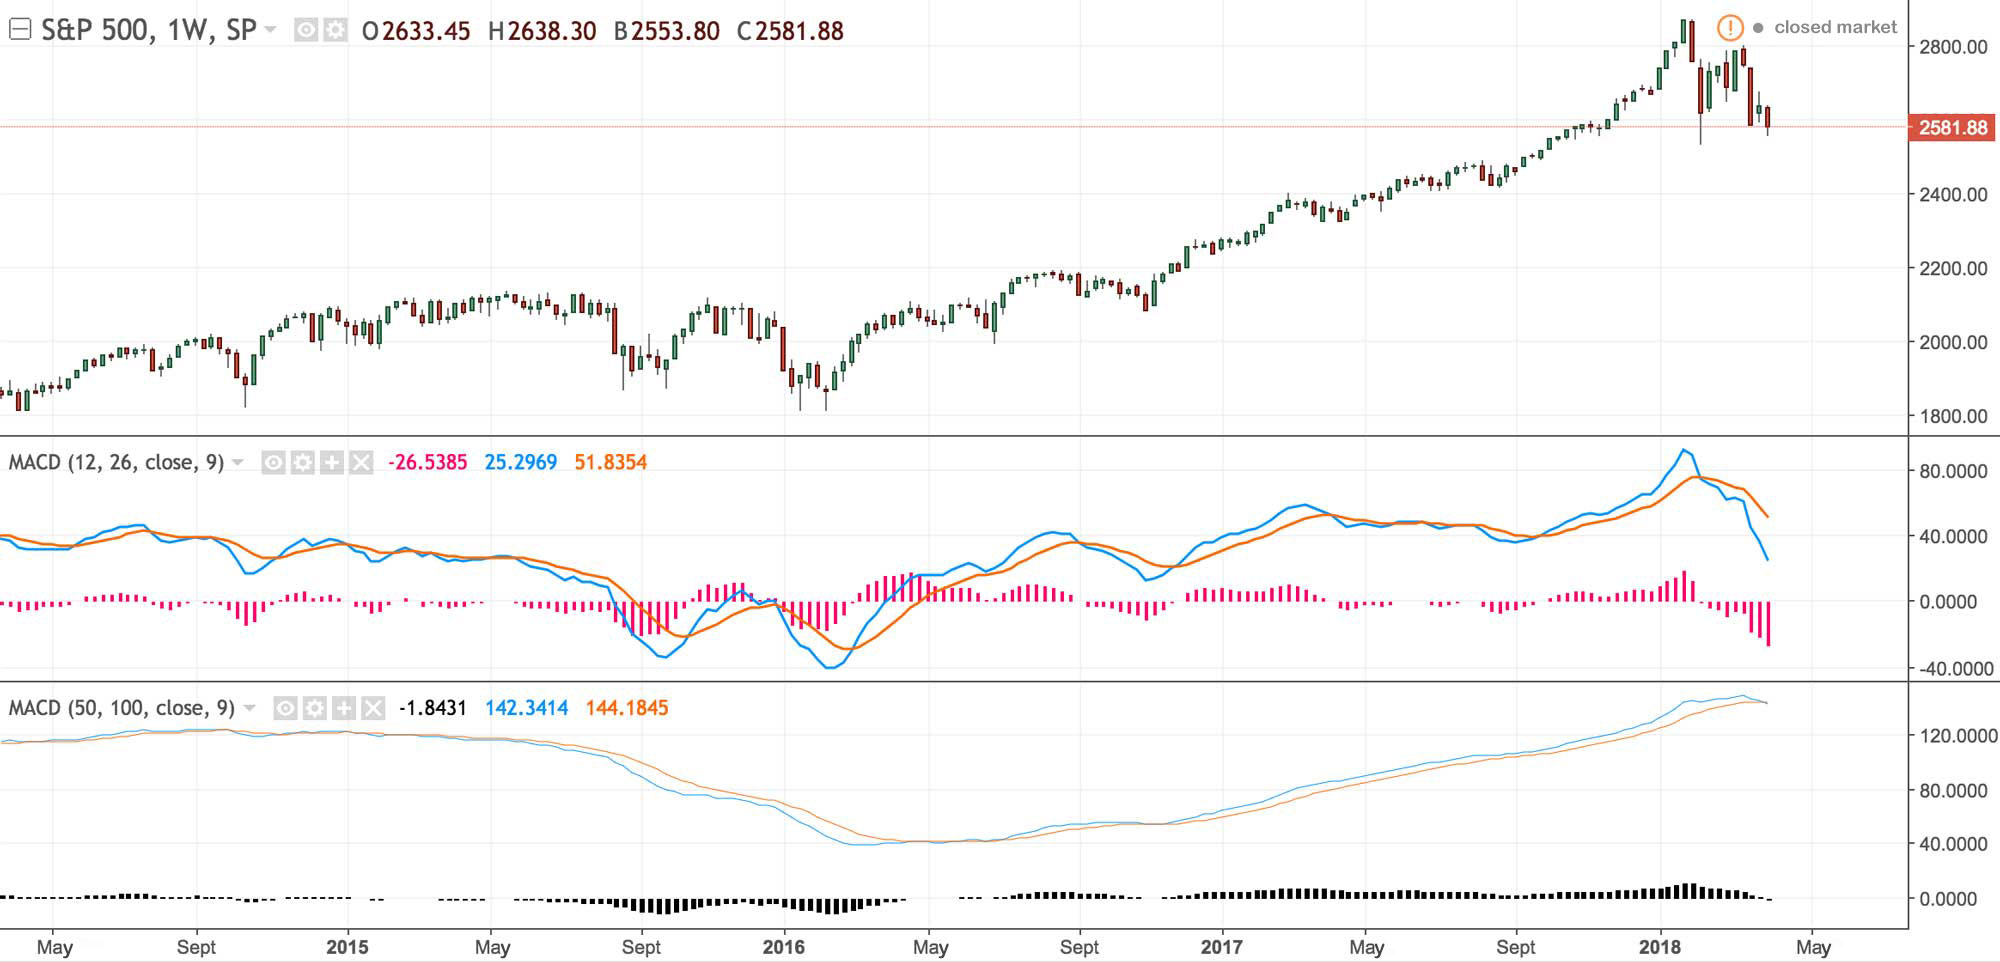
Using 2 MACDs
A more recent strategy combines 2 MACD indicators on one graph, with one being ‘smaller’ than the other. The larger one indicates if a trend is bearish or bullish (for example with parameters 100 and 50 and signal period 1*). The smaller MACD reveals buy/sell signals as described above (parameters 26 and 12, signal period 9).
*A signal period is a parameter which can lessen or amplify MACD and signal lines.
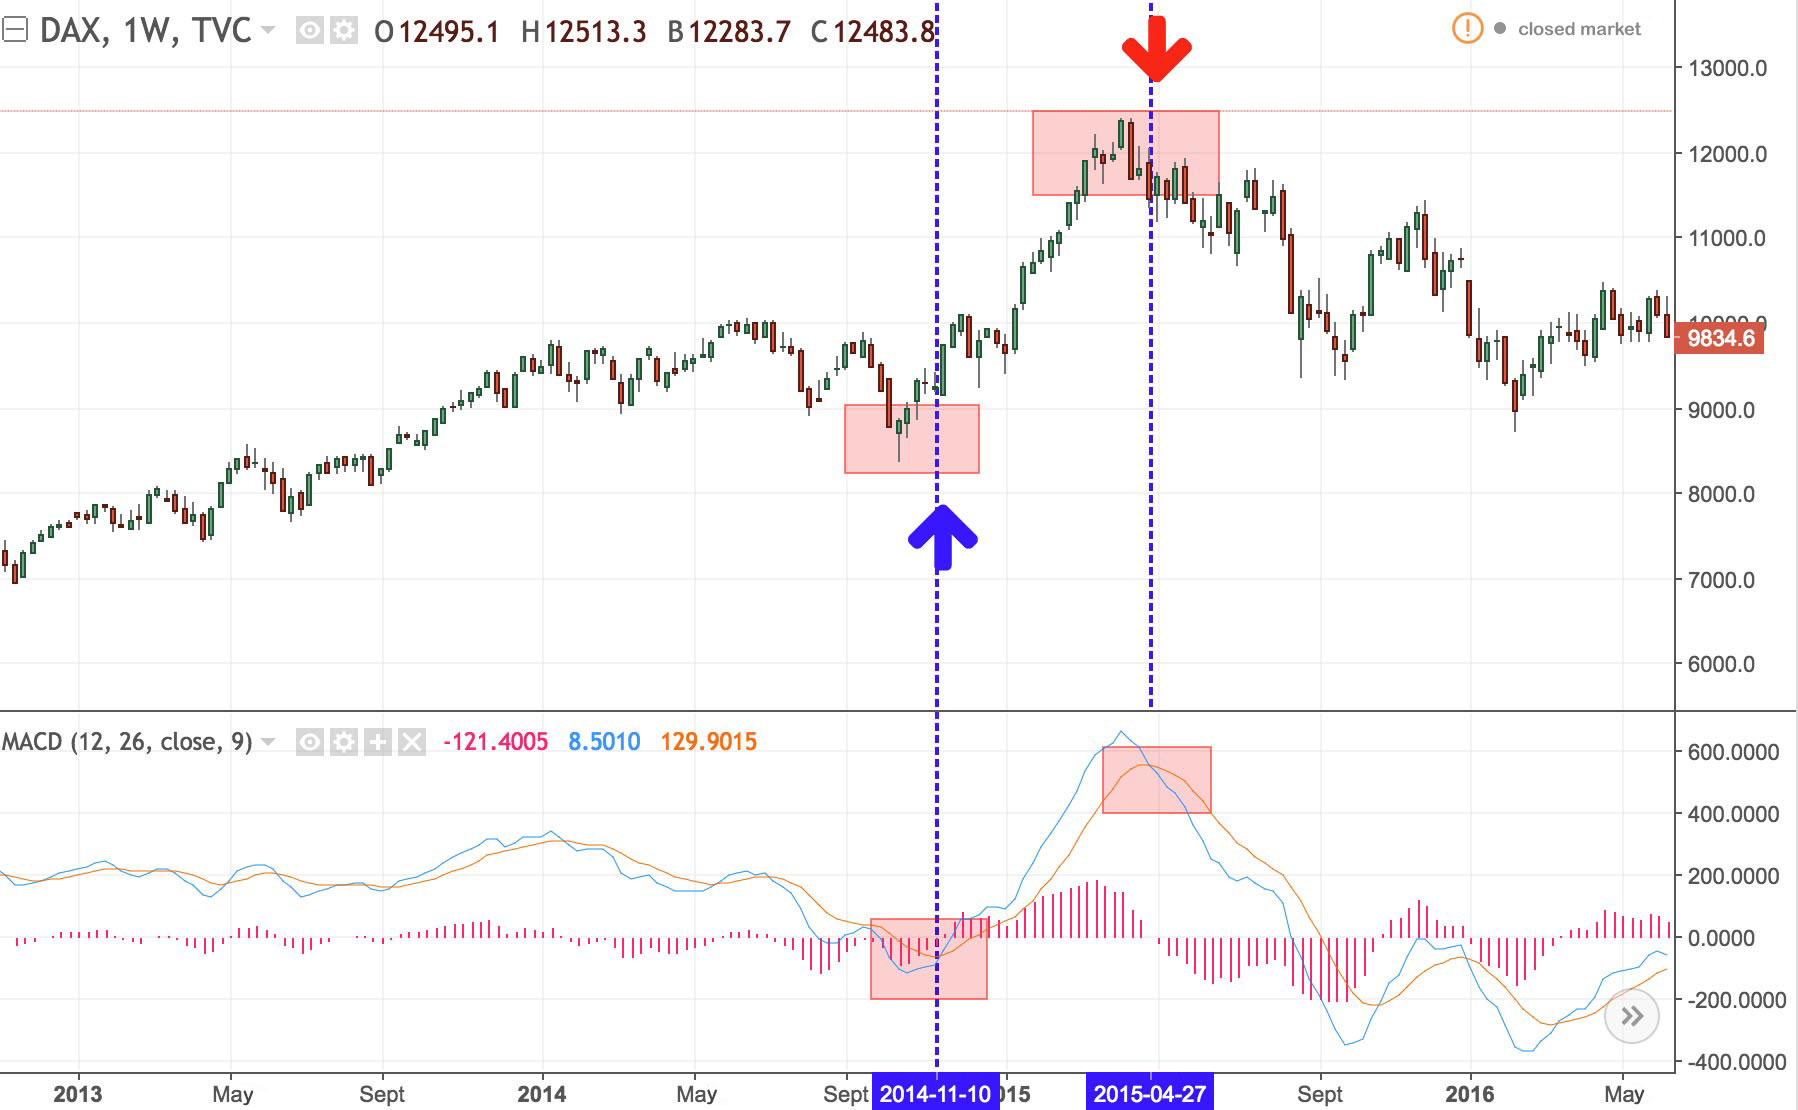
Divergences
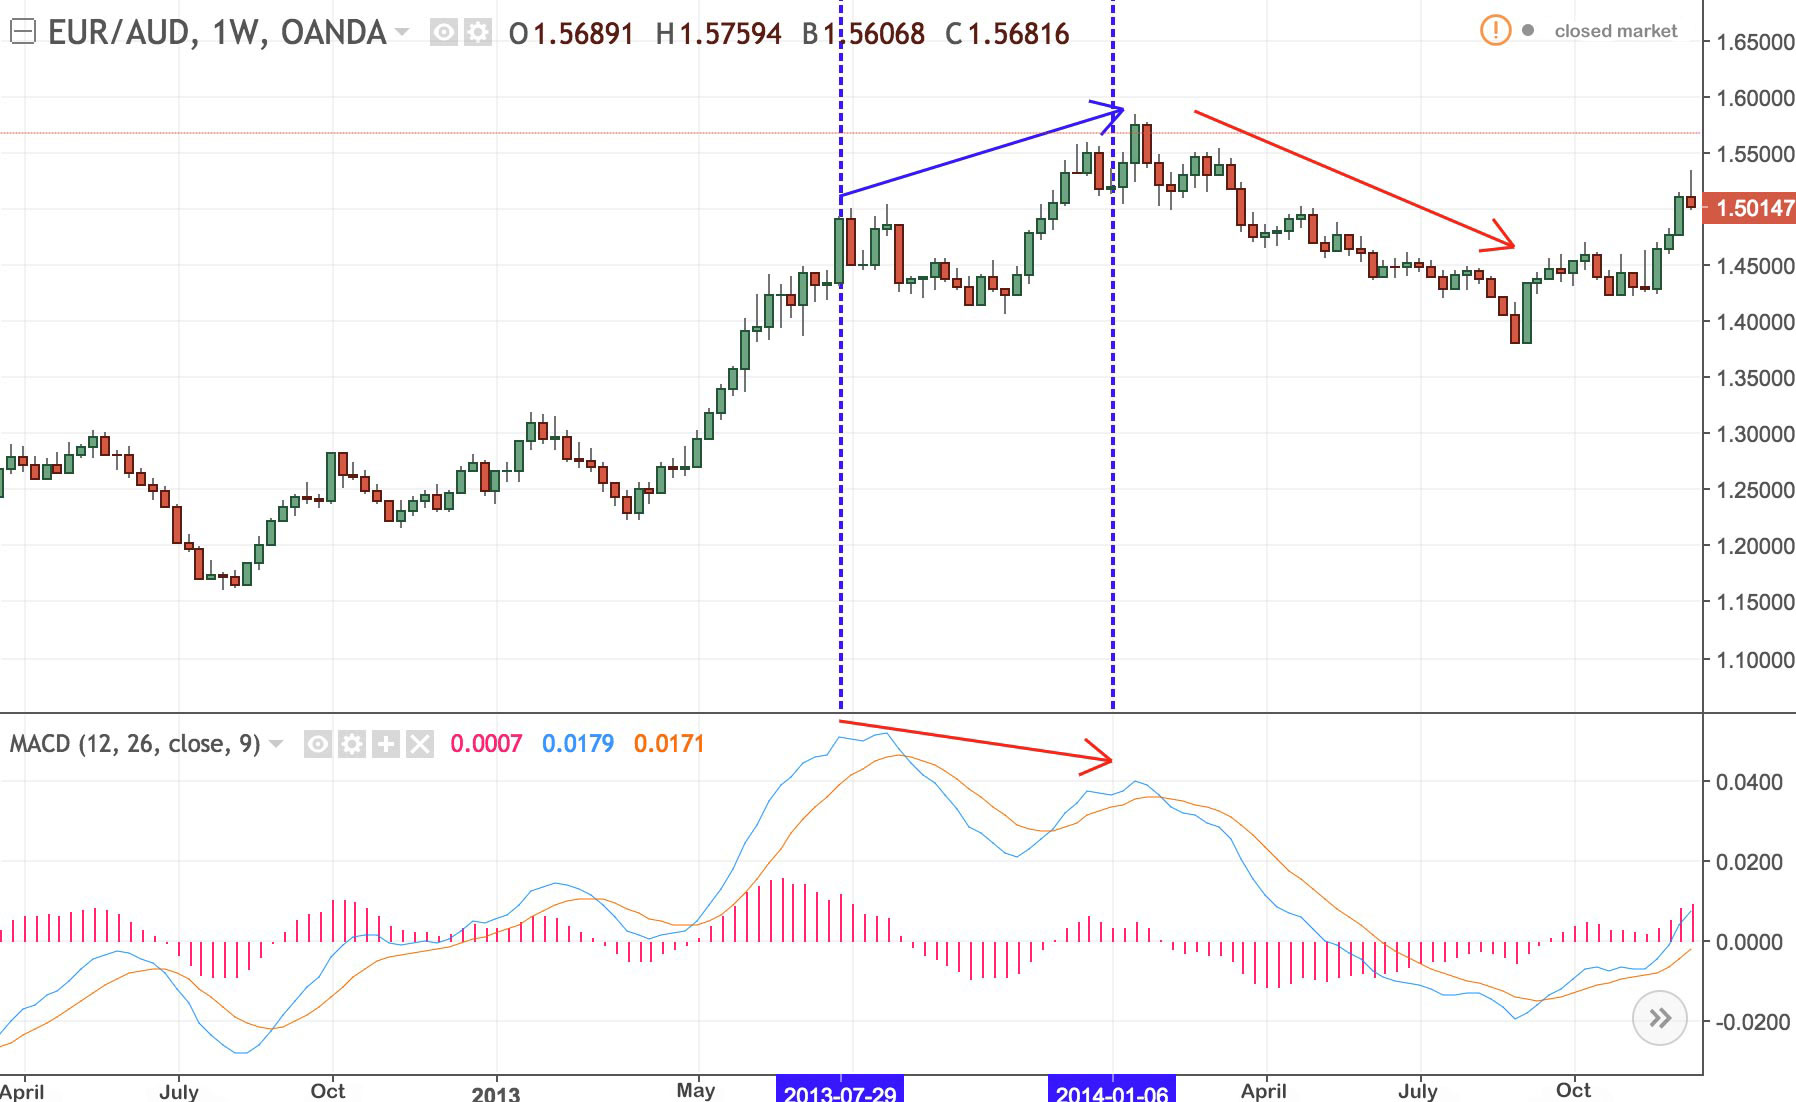
One of the best performing MACD strategies involves divergences, which are very useful to spot trend reversals. When prices reach their highest level twice in a row, with the second occurrence higher than the first, while the MACD indicator does the opposite (two highest points with the first being the highest), prices and MACD are said to be diverging: the market is slowing down and a trend reversal is to be expected. The converse deduction can be made from two bottom levels.
In the following example, prices are said to be going up (blue arrow) while the MACD is going down. Prices then start following the MACD trend and go down again.
How useful is the MACD
Depending on the strategy you choose, using the MACD can work with any kind of trading products, including the FOREX, stocks, commodities, indices… even crypto-currencies. It is also a versatile indicator, revealing market trends and buy/sell signals. However, as with any technical or graphic indicators, it may err and give false signals. You need to be very careful and not rely on it indiscriminately. But you may use it with other indicators to confirm your choice of strategies.


