

Before deciding to buy or sell, a trader can use a plethora of technical or graphic indicators. Moving averages are the most basic and user-friendly indicators whilst still very reliable.
What is a moving average ?
A moving average is a technical tool to smooth data relating to a stock exchange or an asset. This allows you to remove any clutter, any variation, any volatility on the market and to achieve a clearer view of market direction. This is because prices fluctuate constantly, and knowing which way they are heading can become complicated. So you work out a price average over a given period of time, and for each additional time unit you update this average with the latest known data. Hence the name: moving average. The result is superimposed on the chart representing the market considered.
Different types of moving averages
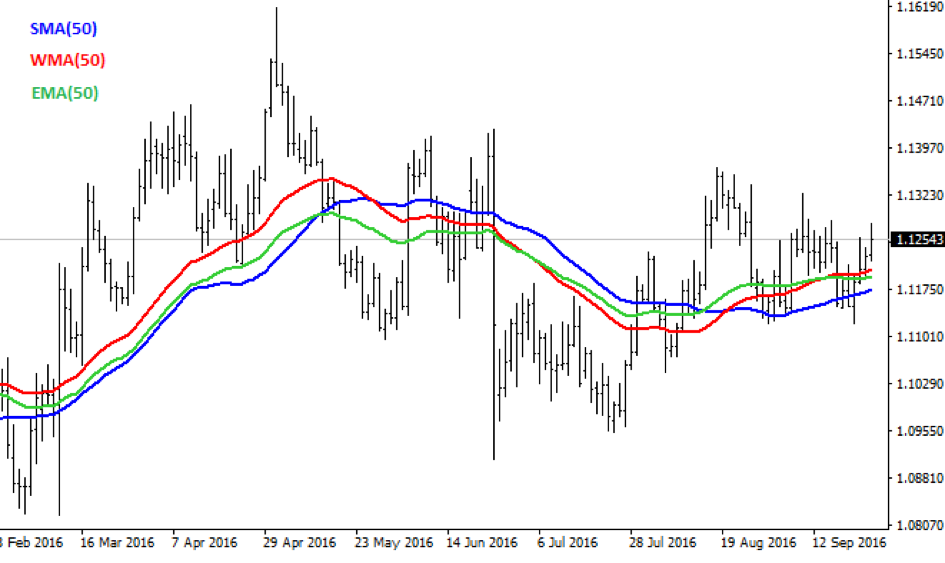
SMA: Simple Moving Average
SMA stands for Simple Moving Average over a given time. If the time unit is 10 days' trading, the last 10 known prices (when the market opens or closes) will be added up then divided by 10. Every day the last 10 prices will be taken into account, until you can draw a graph representing these averages. You have thus smoothed the market over a period of 10 days.
WMA: Weighted Moving Average
A Weighted Moving Average (WMA) emphasises recent prices on a straight-line basis. This means the closer data is to the current time and date, the more weight it will have. The reasoning is that recent prices are more relevant to and a better reflection of the market than 'old' prices. In practical terms, over a 5-day period for example, the oldest data will have a weighting factor of 1, the next will weigh 2, and on the fifth day the price will have a weighting factor of 5.
EMA: Exponential Moving Average
An Exponential Moving Average (EMA) is similar to a WMA, as it puts more emphasis on recent data, hence reacting faster to market changes. However the calculation formula differs. You start by working out the SMA over a given period of time (10 days for example). Then you work out the average of this SMA and the most recent price with a weighting factor, thus giving this last known price greater emphasis. The result is your first EMA, which serves as the basis for the next one. The previous EMA is used daily to update the EMA and the same weighting factor is given to the latest data each time.
So now the question arises: which average should you use? They are actually equally valid, depending on your strategy. WMAs and EMAs are closer to market conditions, and hence more attuned to fluctuations, and they can be a better fit when you are identifying buy or sell signals. But you can also use SMAs for the same purpose by shortening the time unit, as the shorter the period, the closer the average is to market prices.
How to use them
Moving averages, whether simple, weighted, or exponential, can be used in several ways.
Crossover
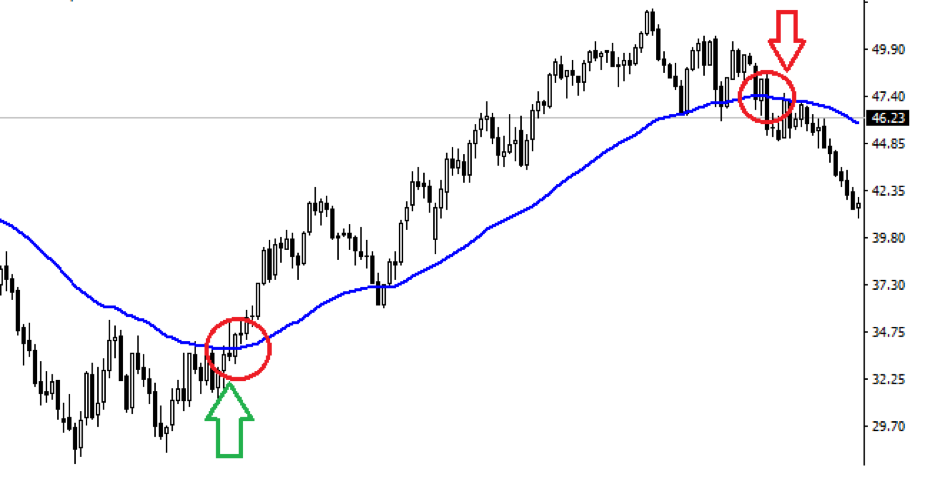
The first and easiest strategy is to choose a moving average over a given time period (for example 20 time units) and to identify when prices rise above or fall below this average. This is called a crossover. When the market falls below the moving average, it is time to sell. When it rises above gives a buy signal.
Double crossover
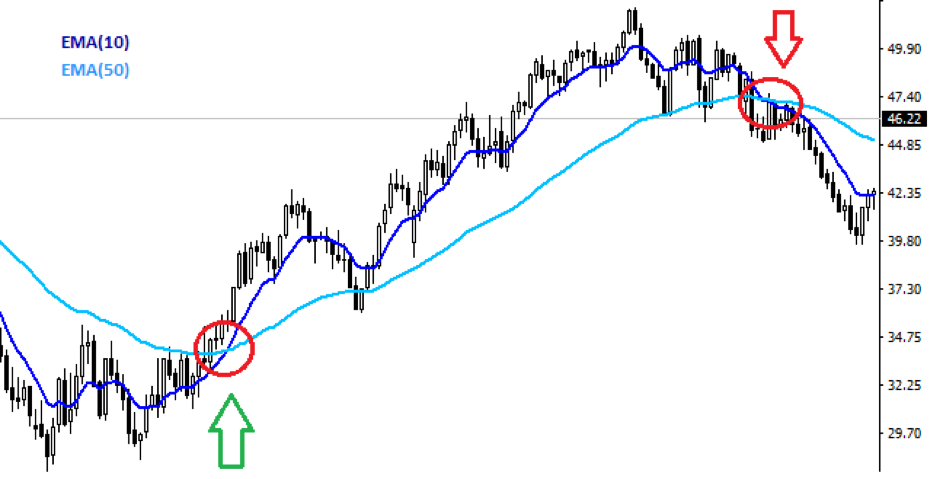
The previous technique is subject to sometimes extreme variations in market prices, and can thus gave incorrect signals. One way around this issue is to use two moving averages over two different periods: a "short-term" one (for example 10 time units) and a "long-term" one (for example 50 time units). The aim is to identify when the short-term average effects a bullish or bearish crossover of the long-term average, which helps to confirm entry and exit signals.
Supports or resistances
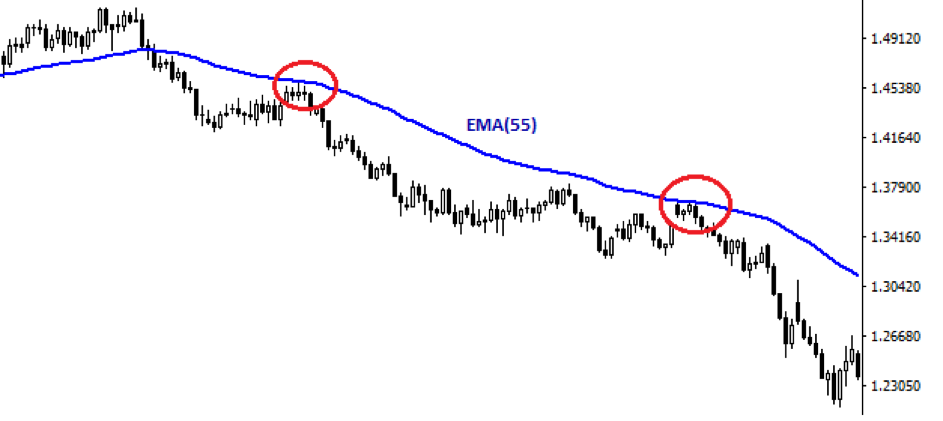
Moving averages can also serve as supports or resistances. For example, prices often rebound precisely at certain averages after 55 or 200 time units.
Limits
None of these strategies work perfectly. In the absence of a clearly defined market trend for example, moving averages can give incorrect signals or reverse signals: just when you think you should buy, the market crashes, or vice versa.
Another difficulty is how to choose the time period: 10, 20, 50, 200 time units? There is no rule to follow and each trader must make his own assessment.
At the same time, in case of a market reversal, averages can take too long to point to a new trend. The answer is to opt for short-term averages, or averages over different time periods, and use the double crossover technique.
For all these reasons, moving averages are often used in conjunction with other indicators, such as the RSI or Bollinger bands, to confirms both trends and buy or sell signals.


