

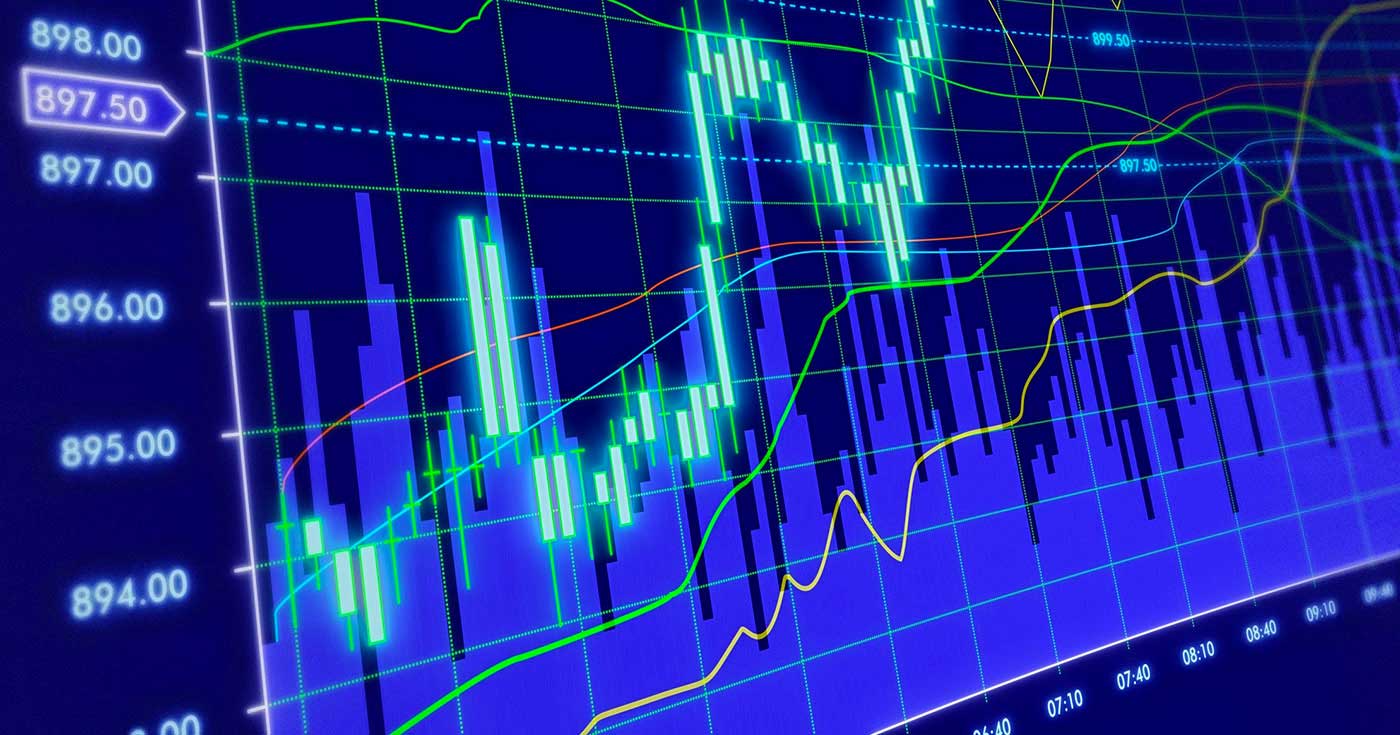
Illustration: Technical Analysis
Technical Analysis
Technical analysis and fundamental analysis, are the two prevailing market research techniques. Technical analysis completely disregards each market's fundamentals as well as those of supply and demand and of political situations. What it does is follow stock market rates both past and current. This type of research stresses that past market behaviour patterns (and hence investor behaviour patterns) will be repeated in the future.
Pros and Cons
The main advantage of technical analysis is how easy it is to understand and to use. This is because it works on any market as long as you know historical prices and can draw a graph. Hence most individual traders use it: you do not need to be an expert and have several degrees to use this type of technique. It is suitable for the forex, shares, commodities, etc.
Another advantage is that market prices usually reveal everything you can learn about a market: market prices mirror the current supply and demand situation. A common saying is: “'The market is always right”. Indeed, if fundamental analyses point to a downturn on the market and real prices are actually rising, it is safer to follow the trend (and buy) than to go against it. So trying to follow and factor in daily economic statistics is a waste of time, the only thing you need to do is analyse stock prices trends and never go against them.
The main drawback of technical analysis is that it is solely based on past rates. Although understanding past trends is useful, it does not tell us what is going to happen. Furthermore, nothing can guarantee that graphics and indicators will always work and endlessly repeat themselves: exceptions can always happen as well as unusual behaviours, which will thwart the efforts of technical traders.
Graphics
Technical analysis is mostly based on graphics and charts. A graph is visually analysed so the beginning or inception of a known and standard pattern can be discerned in order to identify points of entry or exit. Some of the most common patterns are:
support and resistance levels
upward and downward channels
bullish and bearish triangles
head & shoulders
Candlestick charts
There are different ways to depict market rates, such as candlestick charts for example. They allow you to immediately visualise, for a given time frame (over a period of an hour, a day, a week...) the highest and lowest opening and closing market levels. Analysing candlestick charts can sometimes help predict likely future fluctuations, and hence choose entry or exit points.
Technical indicators
There are a great many technical indicators to choose from and anyone can create their own. Some are more popular and frequently used, such as:
RSI : Relative Strength Index
Bollinger Band
Moving averages
Fibonacci
ATR : Average True Range
MACD : Moving Average Convergence Divergence
They add accurate information which is not accessible from observing a simple graphic. But they are all based on past prices. You can find points of entry or exit with the help of overbought or oversold areas of a chart, you can quantify market changes such as volatility, and you can also set gain or stop-loss targets.
Combining indicators
Indicators and graphs can each be used separately, but in general, combining a few to confirm hypotheses is a useful strategy. When several techniques point the same way, the resulting narrative is all the more likely. Conversely, if indicators point in different directions, it may be best not to take a position.
At the same time, remember not to use too many at a time: more than three or four becomes meaningless as in the end, they are all based on the same data.
Remember as well that it is wiser to combine a graphic with a technical indicator rather than two technical indicators: this will provide two different viewpoints from which to analyse a market.
Lastly, combining market prices with an indicator can help you spot deviations which point to imminent trend reversals. For example, if you notice a Top which is higher than the previous one in terms of market prices, when the indicator's Top is lower than the previous one, you can assume the market is slowing down and the trend will be reversed.


