

Illustration: How to use the Ichimoku Kinko Hyo indicator?
The unusual name of Ichimoku Kinko Hyo is given to a sophisticated indicator, which though very popular with traders, can seem confusing and so busy that it puts off some of us from using it. This is because simply charting the indicator on a graph adds five different lines as well as a « cloud » in two colours. The graph becomes almost impossible to interpret.
Originally, a Japanese journalist named Goichi Hosoda described this indicator in a 1969 book which unveiled the results of thirty years’ research in the field of trading.
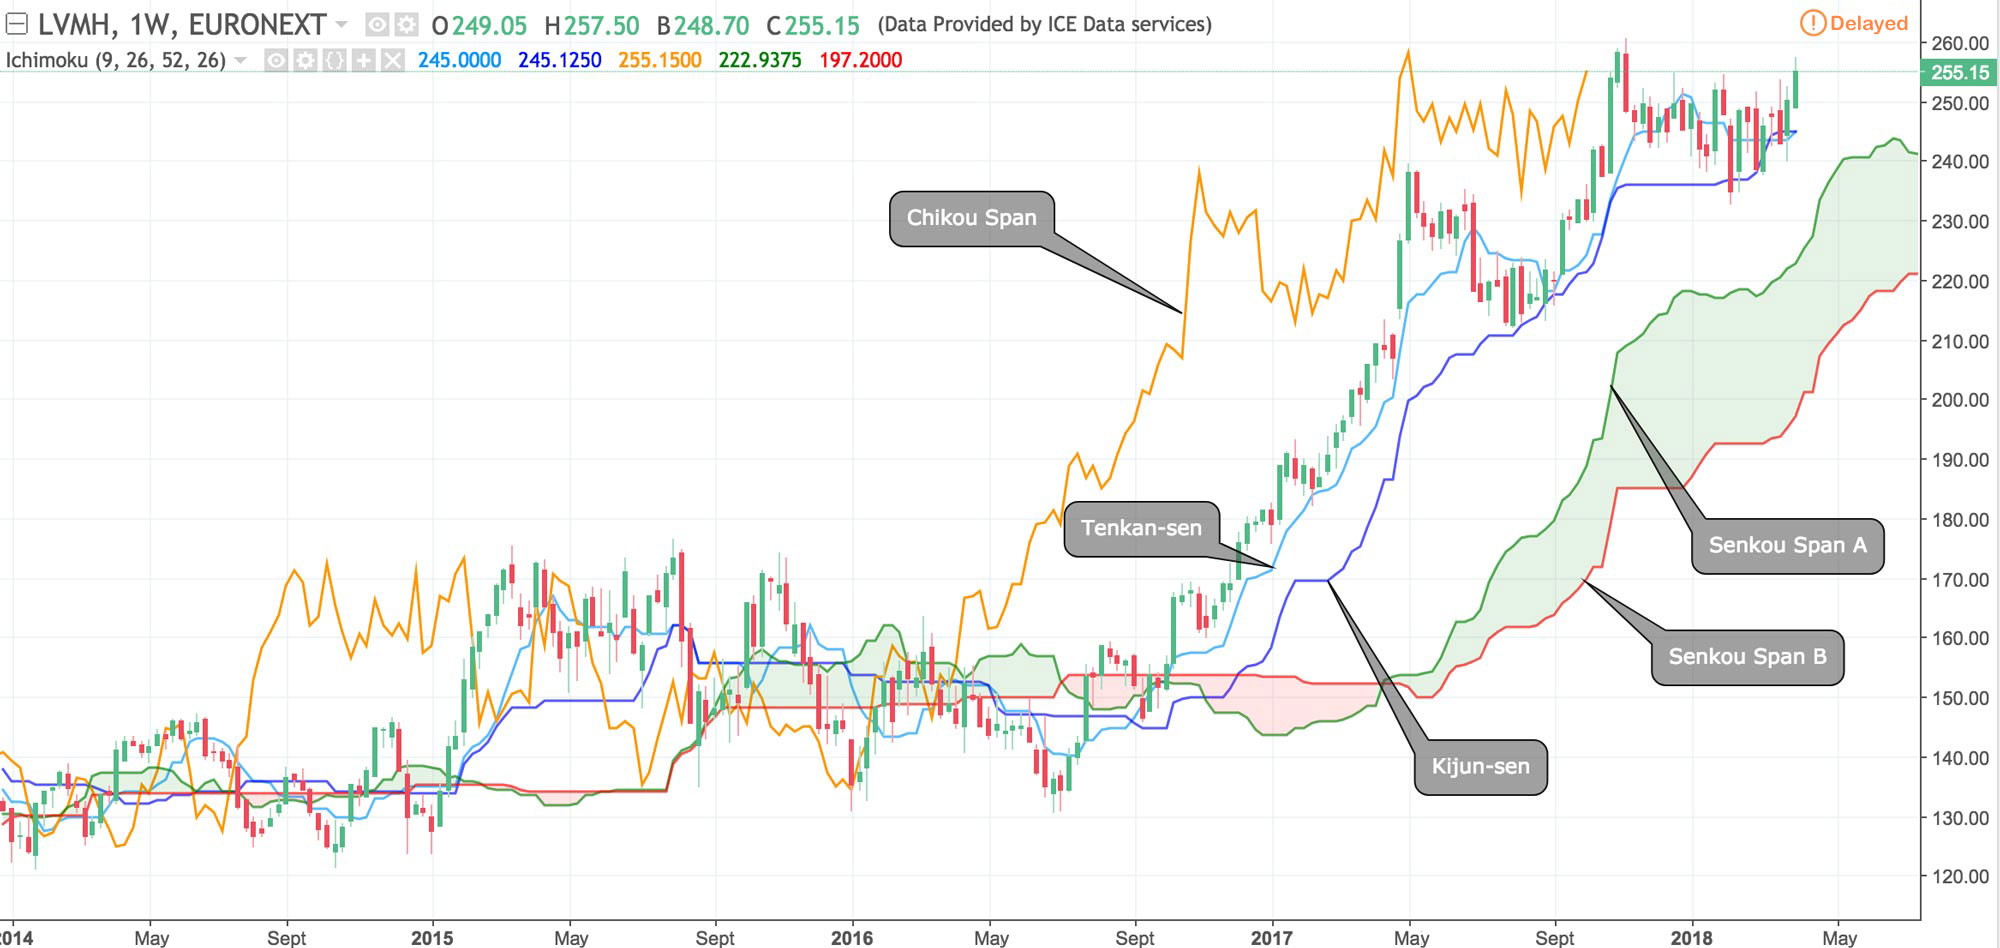
The Ichimoku indicator comprises five lines, with each one giving different information about « Price action ». The space between two of them is coloured and thus forms a sort of cloud. Most traders who use this indicator focus on the cloud as the key driving factor.
A few explanations
For obvious reasons you will need the following translation chart for all the terms necessary to this indicator and their corresponding colours on the graph.
|
Japanese |
English |
Colour on the graph |
|
Ichimoku kinko hyo |
Glance equilibrium chart |
- |
|
Kumo |
Cloud |
Red and green |
|
Tenkan-sen |
Conversion Line |
Light blue |
|
Kijun-sen |
Base Line |
Dark blue |
|
Senkou Span A |
Leading Span A |
Green |
|
Senkou Span B |
Leading Span B |
Red |
|
Chikou Span |
Lagging Span |
Orange |
Each line helps visualise a precise average as detailed below :
Tenkan-sen = (9-day high + 9-day low) / 2
Kijun-sen = (26-day high + 26-day low) / 2
Senkou Span A = (Tenkan-sen + Kijun-sen) / 2
Senkou Span B = (52-day high + 52-day low) / 2
Chikou Span = Closing price projected back 26 days
Parameters (9, 26, 52) can be changed easily and the figures suggested here are only the most common. Please note that all the calculations are simple price averages or averages of highest highs and lowest lows over different time spans. Indeed, the Ichimoku indicator is simply an advanced form of price average comparison.
Identifying a trend
The first way to use the indicator is to identify global market trends. The trend is bearish if prices are below the cloud and bullish if they are above. When prices are inside the cloud (whether it is green or red) the trend is indeterminate or uncertain.
Broadening this original rule can allow you to spot if a trend is consolidating. When advanced line A goes upward whilst above advanced line B (green cloud), the upward trend is consolidating. Similarly, a downward trend is consolidating if advanced line A is going downward whilst below advanced line B (red cloud).
This means that you buy above the cloud but try to sell below the cloud. Ichimoku thus helps you confirm a strategy by helping you identify converging signals.
Changes and reversals in trends are also apparent when clouds go from red to green and vice versa.
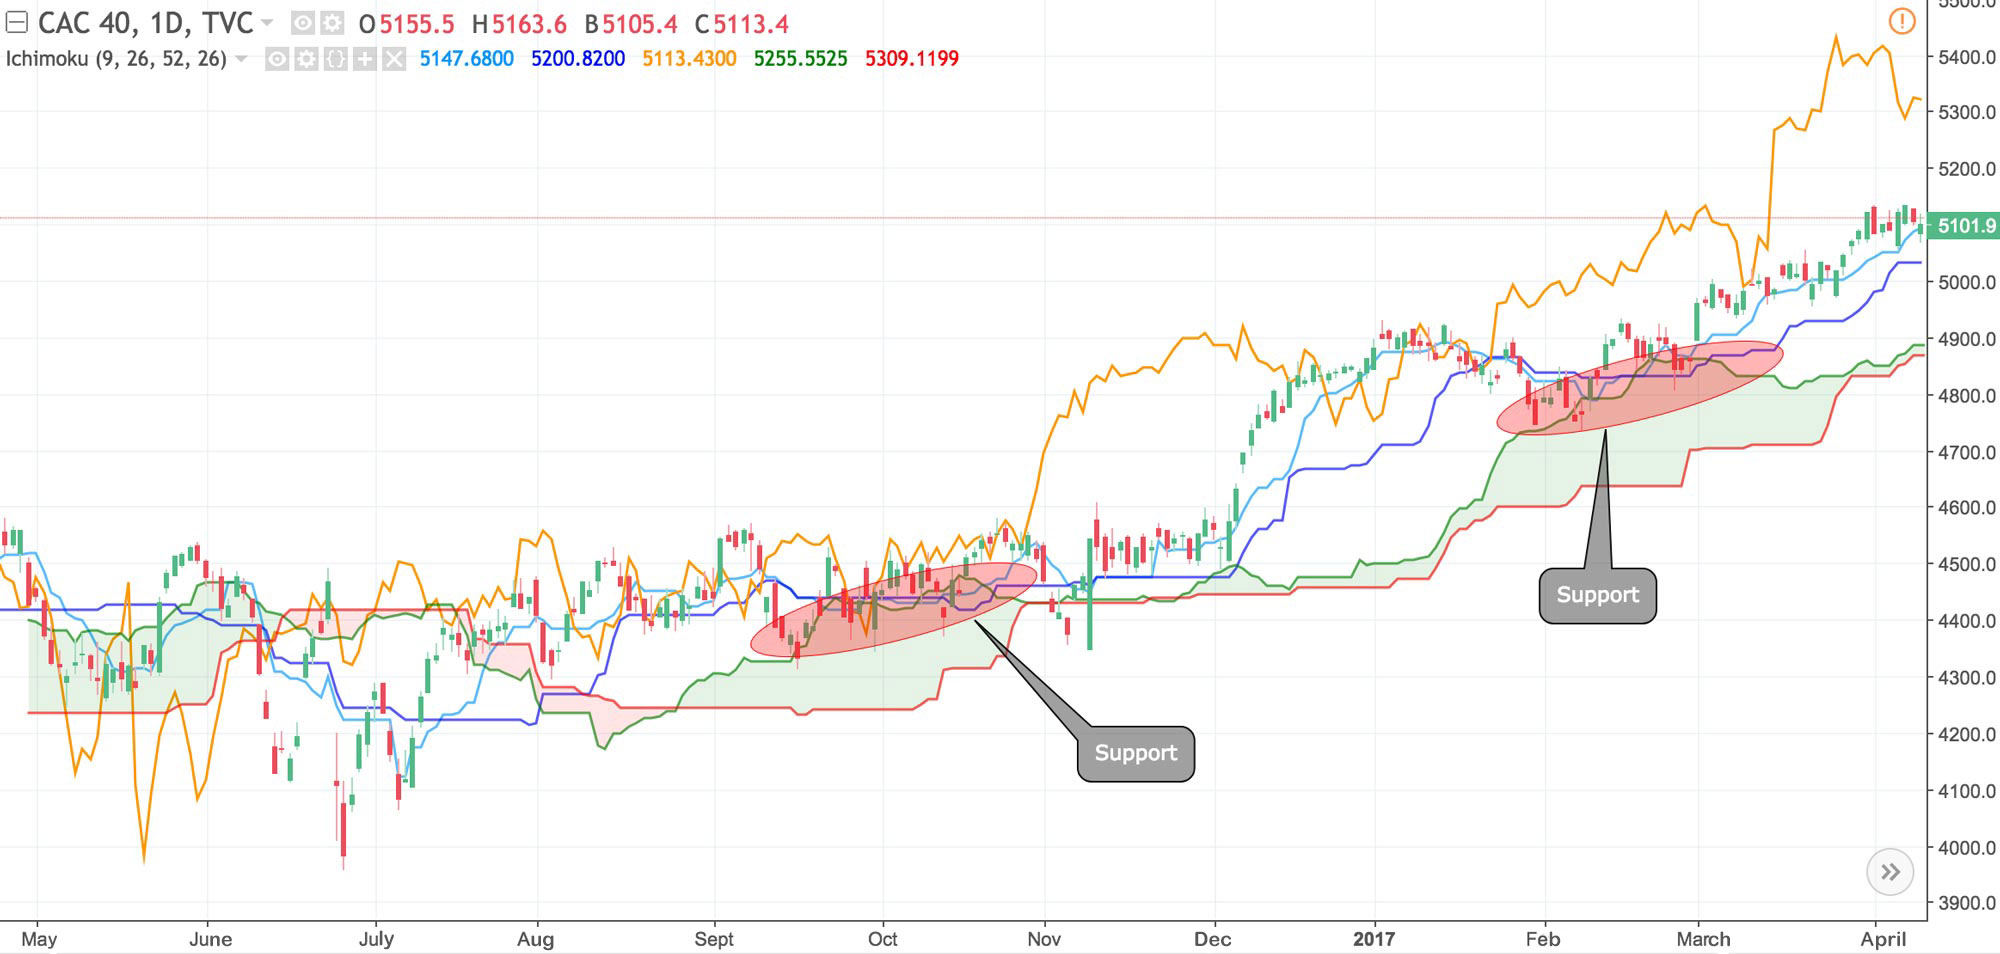
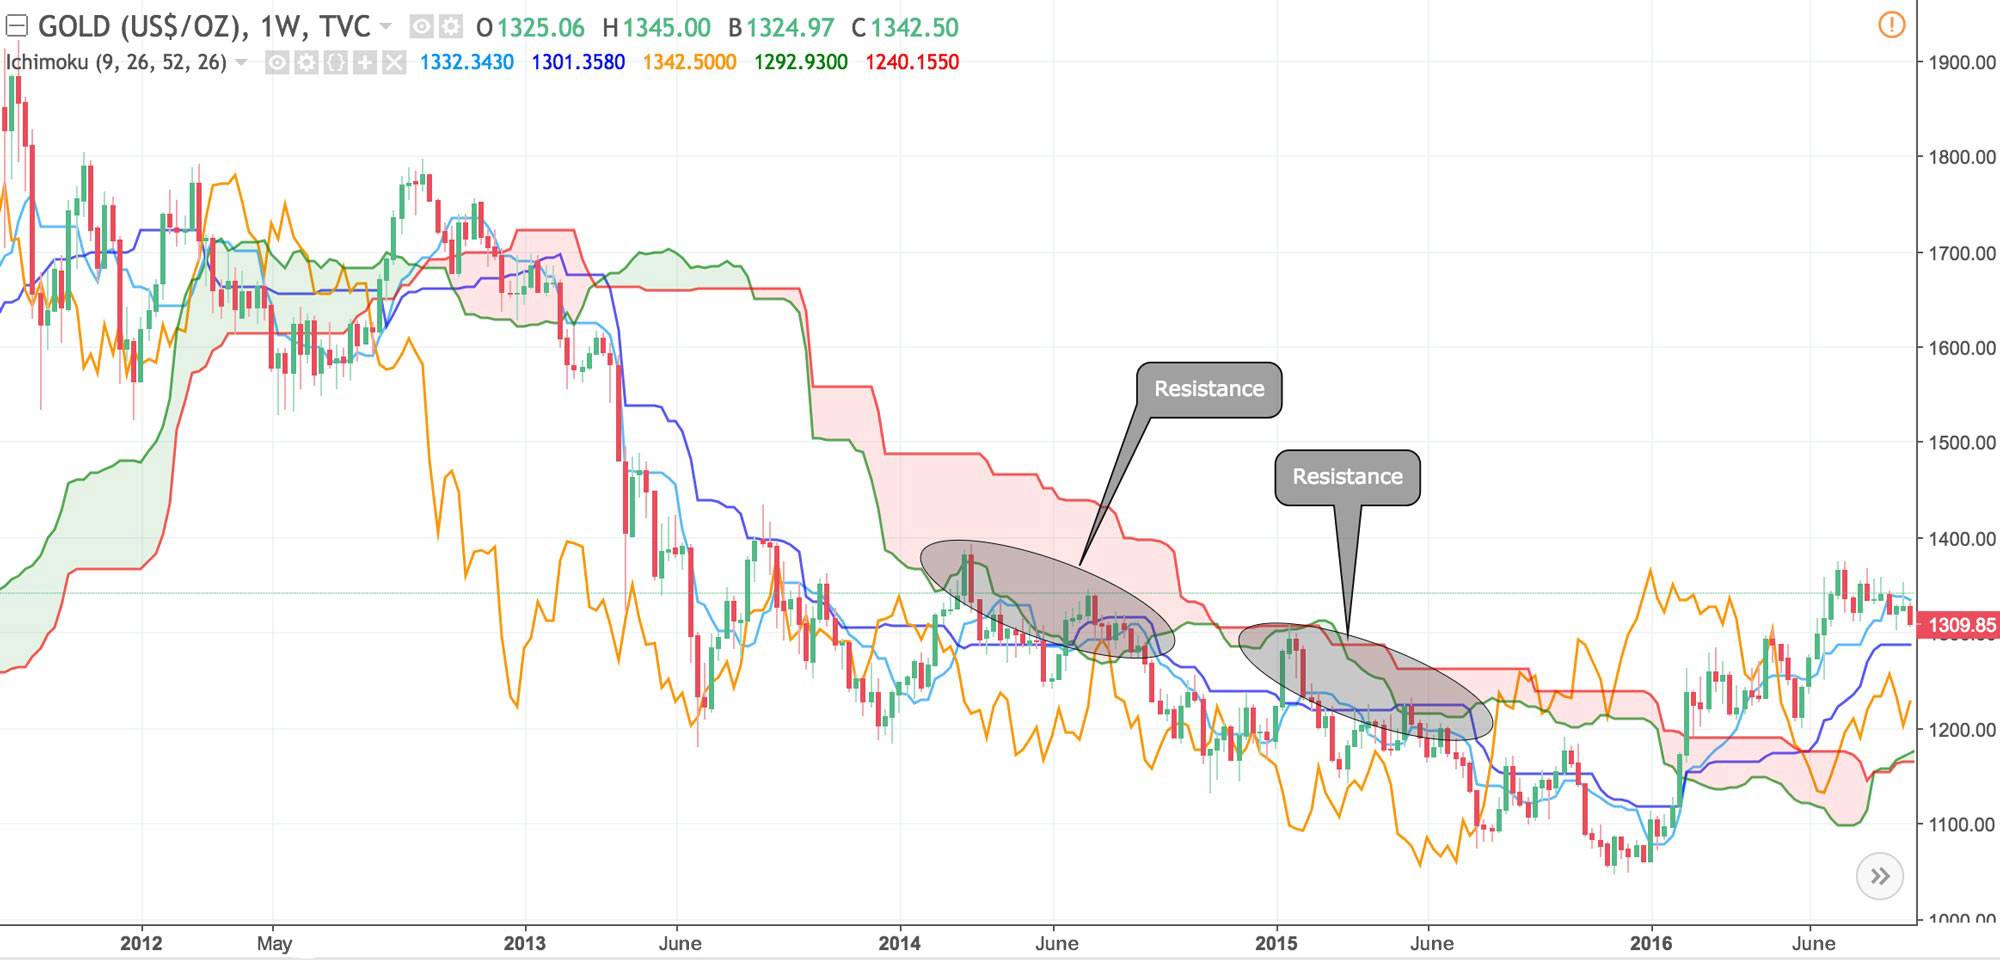
Supports and resistances
Calculations are made with the cloud shifted forward by 26 days, which may help spot future support and resistance zones. Indeed, in some cases prices rebound at the edges of the cloud, with the Senkou Span A acting as support and the Senkou Span B as resistance.
Line crossings
Conversion-Base Line Crossover
As with any moving average, conversion and base line crossovers help spot points of entry in conjunction with the position of the crossover relative to the cloud :
- Bullish cross above the cloud : buy
- Bearish cross below the cloud : sell
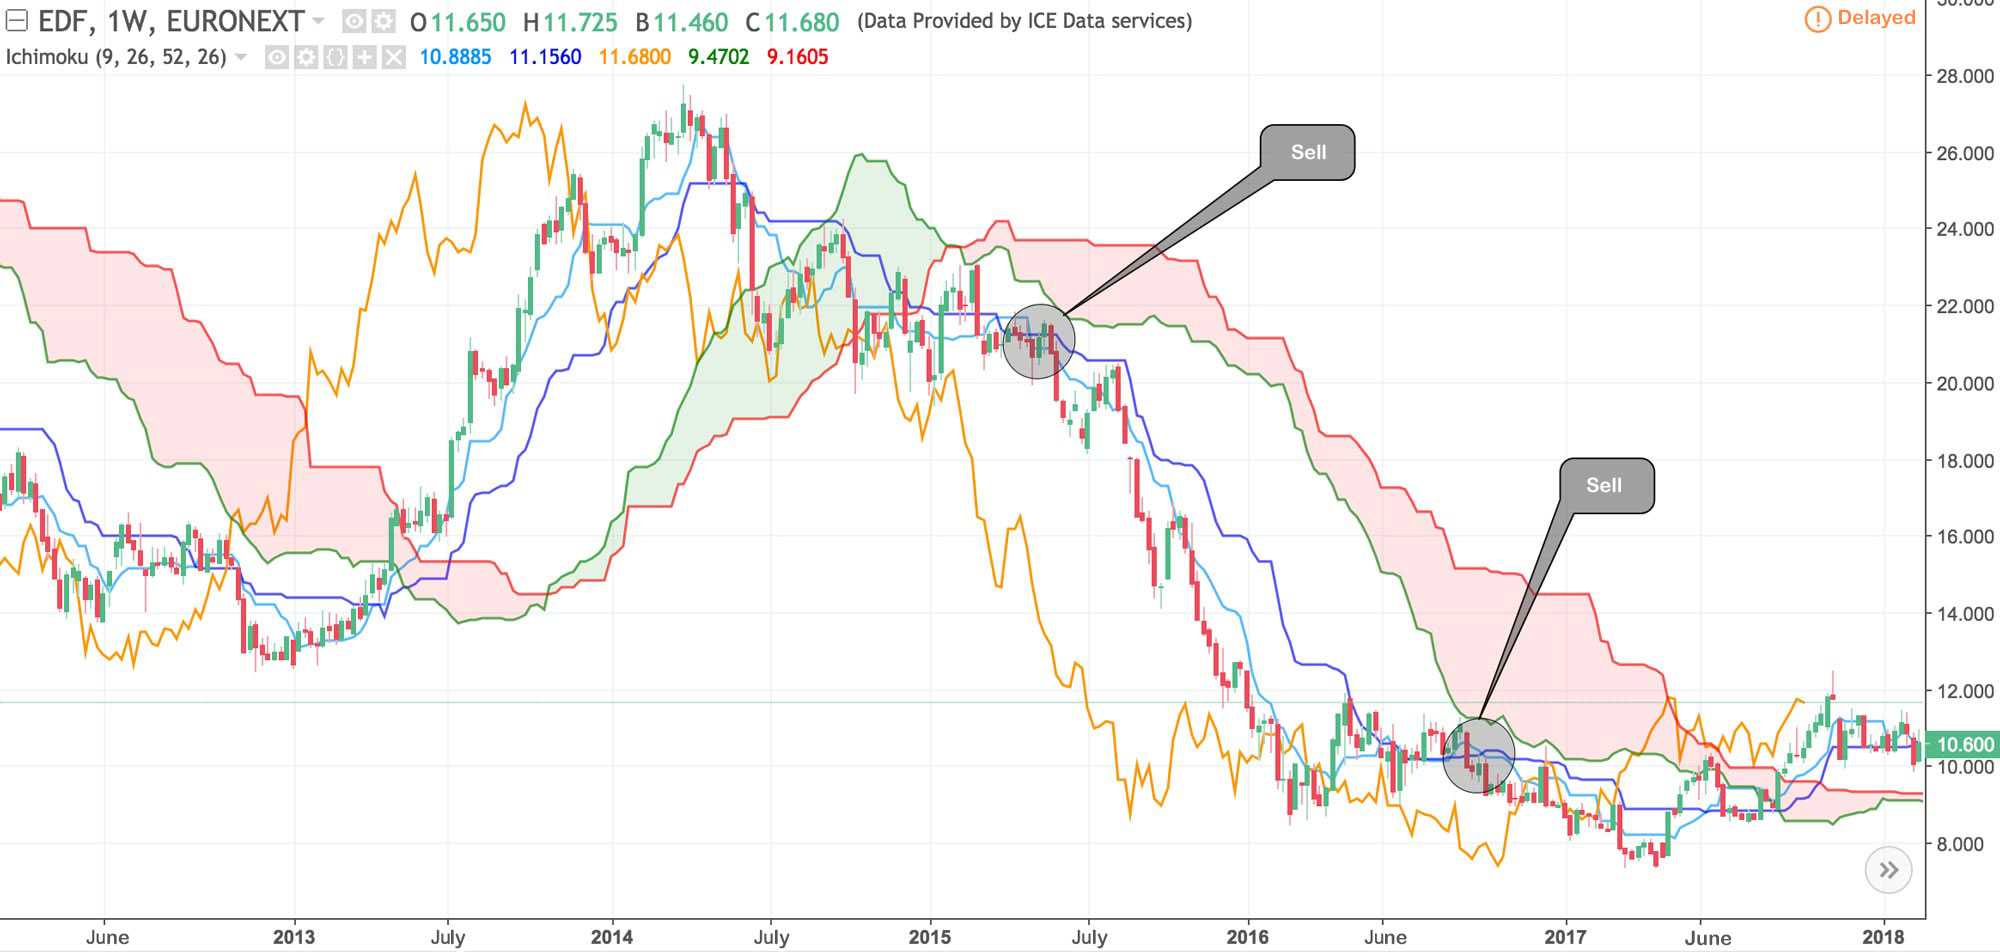
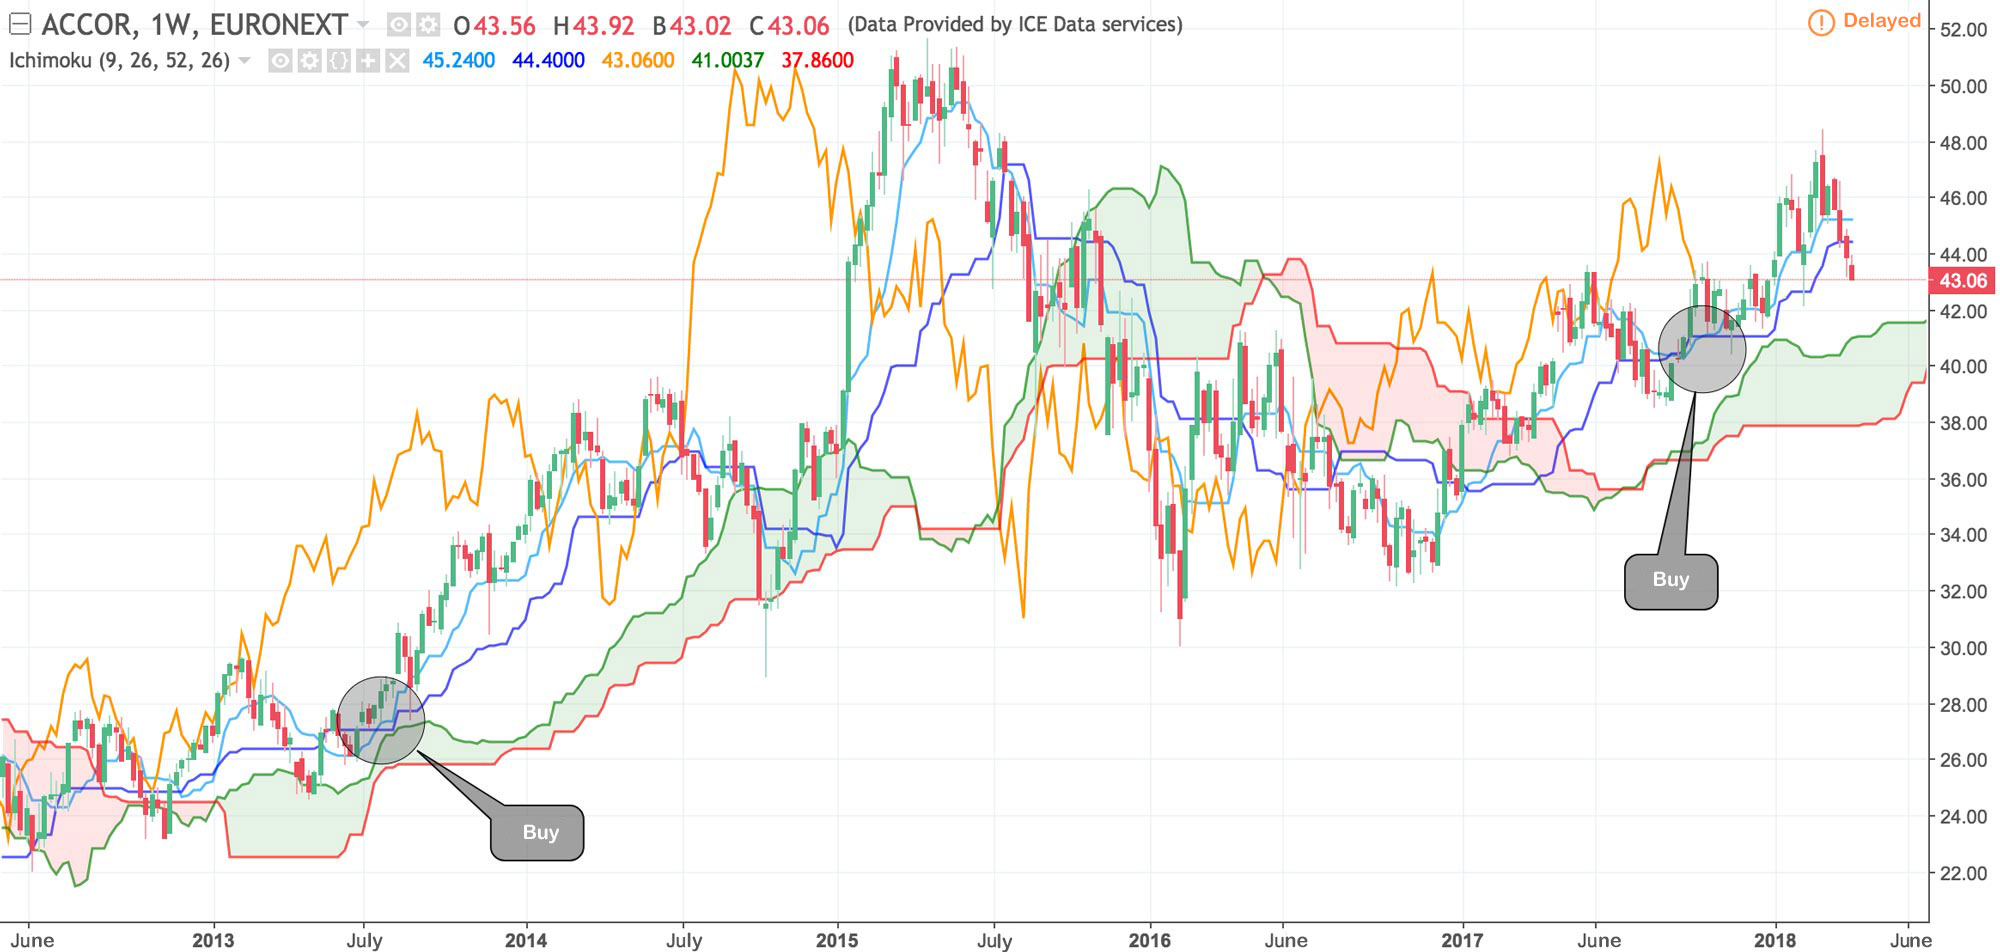
Price-Base Line Crossover
The same applies in an identical way to price and moving average lines crossing, when price and base line cross over: buy/sell signals appear. Once again, the cloud is there as confirmation. This type of crossover is very similar to the previous one (when conversion and base lines cross).
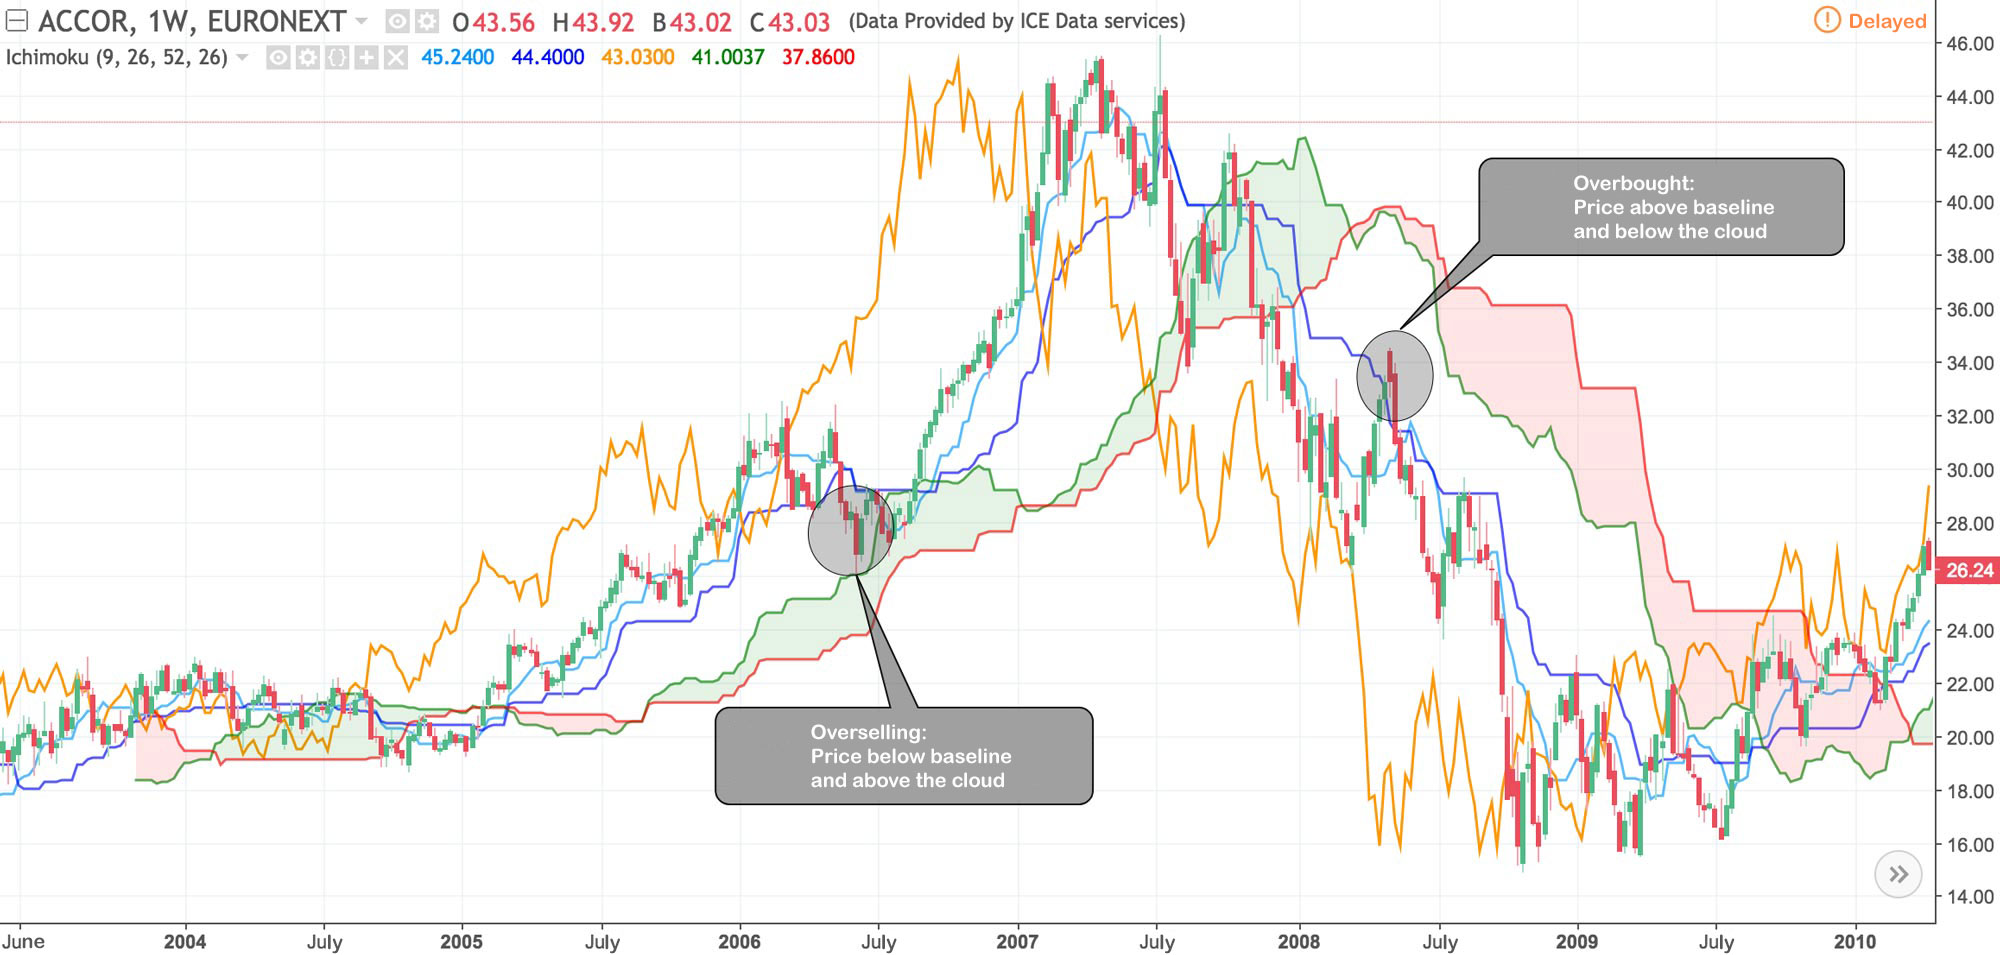
Ichimoku can also indicate overbought zones when the price is above the base line but below the cloud, or oversold zones when the price is below the base line but above the cloud.
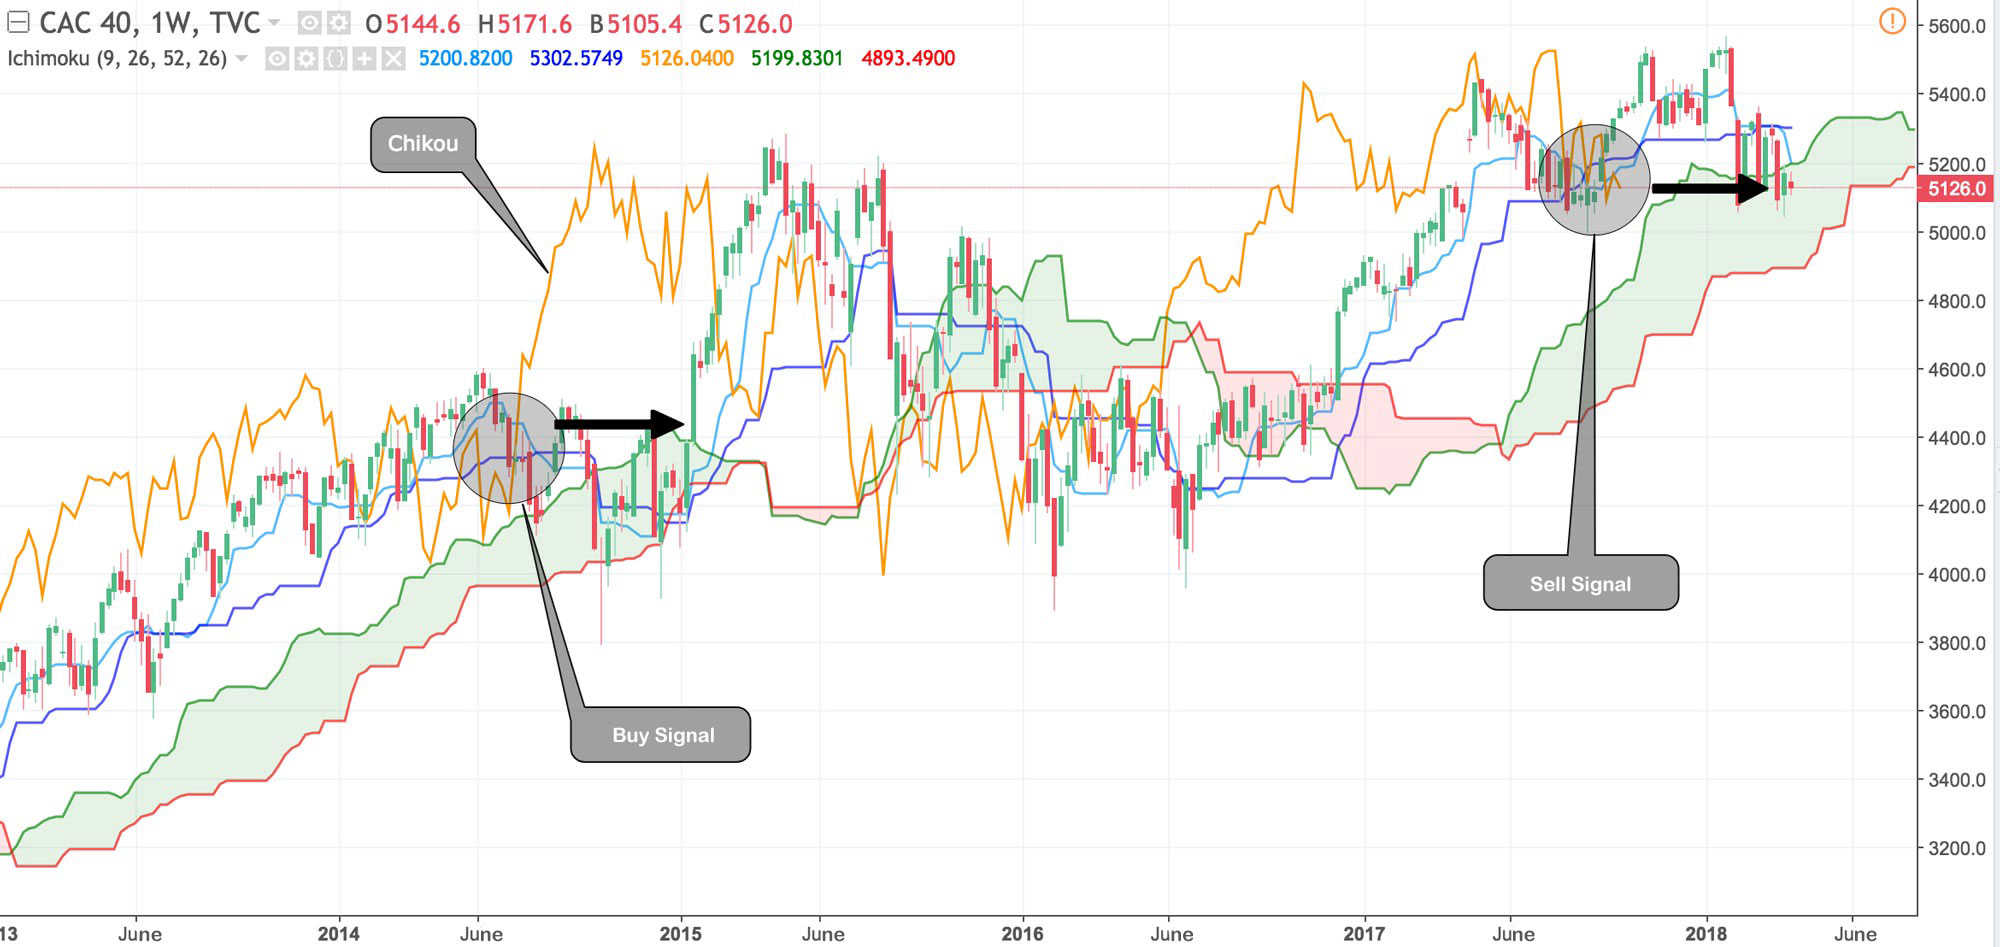
Price-Chikou Crossover
Lastly, please remember that the « Chikou » line shows the current closing price set back 26 periods (modifiable parameter). This helps you confirm how you feel about the market.
- If the Chikou line crosses above the price line (or the cloud) : you should buy.
- If the Chikou line crosses below the price line (or the cloud) : you should sell.
To sum up
Its many lines make using the Ichimoku Kinko Hyo technical tool a bit daunting, if not frightening. But here is a simplified outline of the indicator: if the price is below the cloud, the trend is bearish and you should try to sell and avoid long positions. If the price is above the cloud, the trend is bullish and you should buy and avoid short positions.
Lastly, given how confusing the Ichimoku indicator may look, it is usually easier to use it with long timeframes such as weeks and months, in order to smooth a series of averages and see things more clearly on the graph.


