


Illustration: Fibonacci Trading Strategies
The technical indicator called "Fibonacci retracement" is more complex but for many traders it is key to predicting market changes. The name Fibonacci comes from Italian mathematician Leonardo of Pisa (13th century), also known as Leonardo Fibonacci.
Origins
He highlighted a specific feature of the number sequence which bears his name: the Fibonacci sequence. This consists of the numbers 0 and 1, followed by a series of numbers, each being the sum of the preceding two.
The result is: 0, 1, 1, 2, 3, 5, 8, 13, 21, 34, 55, 89, 144… and so on.
This sequence is peculiar because the ratio of two successive numbers tends towards a constant number called the golden ratio, and equal to 1,618, in decimal terms, 61,8%.
Example : 55/89 = 89/144 = 0,618
Other ratios may be extrapolated from the sequence, by dividing two numbers separated by:
- two numbers: 21/55 = 55/144 = 0,382 = 38,2%
- three numbers: 13/55 = 34/144 = 0,236 = 23,6%
These three percentages are the basis of Fibonacci retracements and objectives. In fact, the 'perfect' proportions linked to the golden ratio are everywhere in nature (galaxies, mountains, shells, plants, the human body…). Humans use them as well in fields as varied as painting, music, architecture... Financial markets are only following the same rule.
How to use the Fibonacci sequence ?
After a strong market change, when the market is slowing down or retracing its steps, a rebound in one of the Fibonacci ratios is often apparent. When the market rebounds and goes back to its initial trend as well, the market tends to achieve a level related to the Fibonacci ratios. These are all supports and resistances appearing at these levels.
The following example shows a drop in the price of the EUR/USD pair from 1.6045 to 1.3975. When the market rallies, it reaches an area corresponding to 61.8% of the previous change. It rebounds, and prices fall to almost exactly 61.8% further than the initial movement. It looks like magic. Can it be chance? With this example, the price rebounds several times on the support before aiming again directly for the almost perfect retracement level of 61.8%.
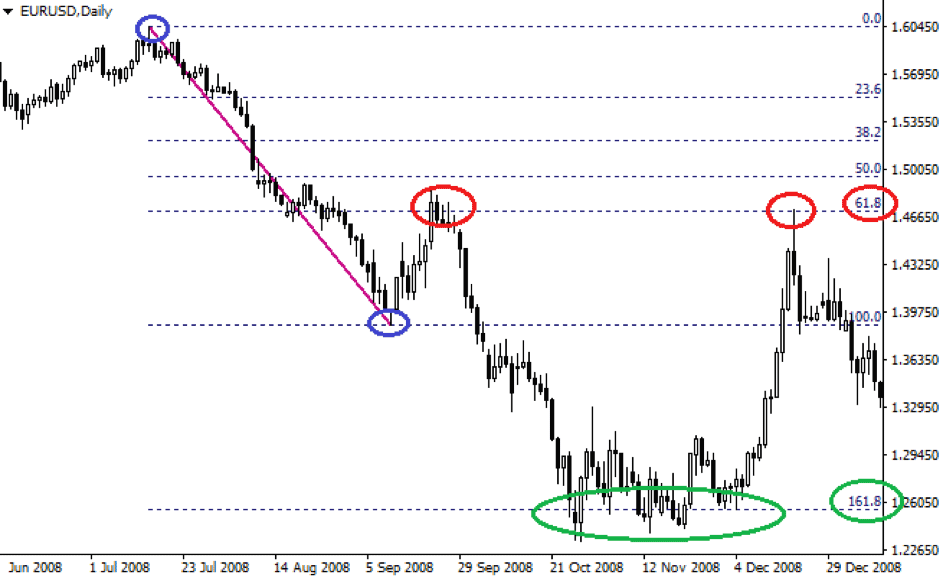
Conversely, in a bullish trend for example, traders will aim to buy at a Fibonacci ratio level when prices fall. So that when the market rebounds, a suitable target would be 161.8% of the high point.
Such examples can be found on any market and over any period of time. Most trading platforms and software include this indicator with its various levels, so all traders have to do is identify the start and end points (usually a high and a low point) to reveal 100% of the movement, and retracements and extensions can be based on these points.
Another level is often added, 50%. It is unrelated to Fibonacci but empirical evidence shows that it is a frequent level for change to take place, and hence useful to include in the Fibonacci indicator.
Pros and cons
Every trader and technical analyst knows these percentages. Which means that if everyone reacts at the time and at the same levels, the validity of the method is confirmed, and this explains why it works.
However, Fibonacci ratios are not a fail-proof magic method. First of all, they deal with areas, not accurate levels, even if they do work rather well. For stop-loss signals for example, it is best to place them close to these levels rather than precisely on them.
It is also true that if you wish to confirm objectives or reversals, you should use this method in conjunction with other indicators. You will thus be able to reinforce signals and accrue your chances of success.


