

Graphical analysis is a big area of trading. Some swear by it! There are different types of graphical market representations: simple line, zone, bars, candlestick or "Japanese" charts. This last visualisation is widely used by traders because it allows to draw several pieces of information at the mere sight of the graph and potentially predict future prices.
Candlesticks, also called candles, were created in Japan in the seventeenth century to represent the price of rice. This is the oldest form of graphical analysis.
Here are the different graphical representations.
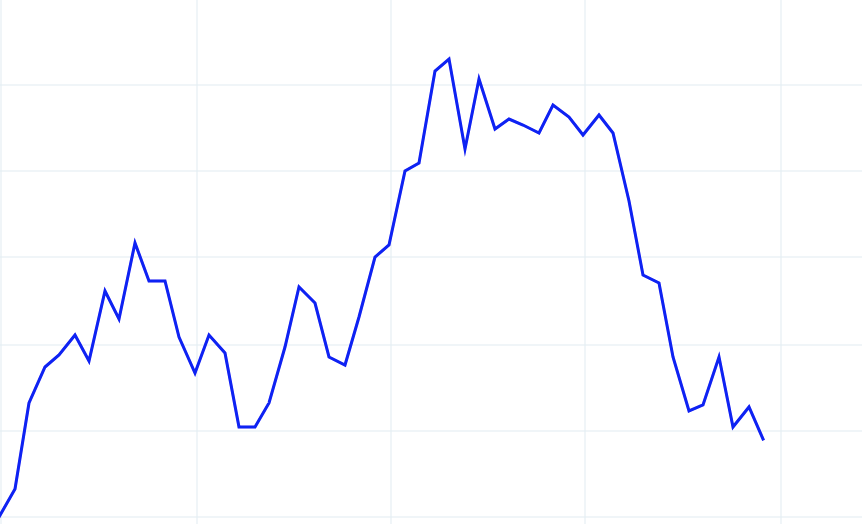
Line
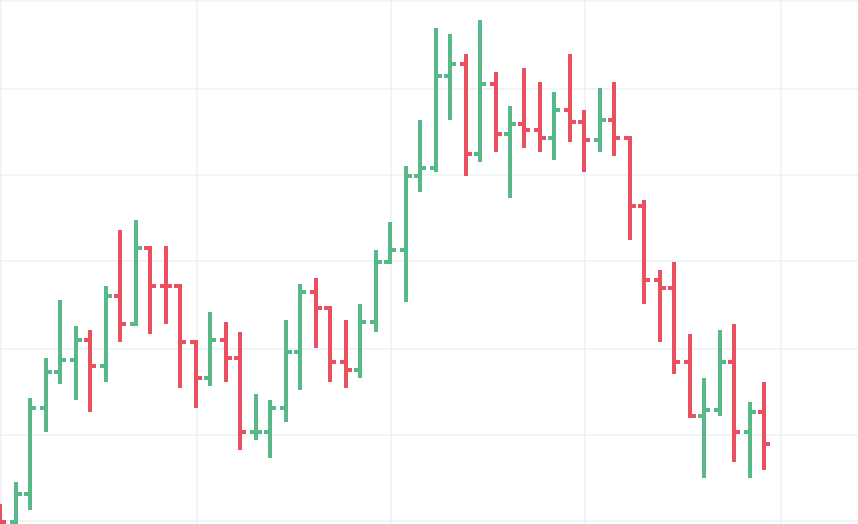
Bars
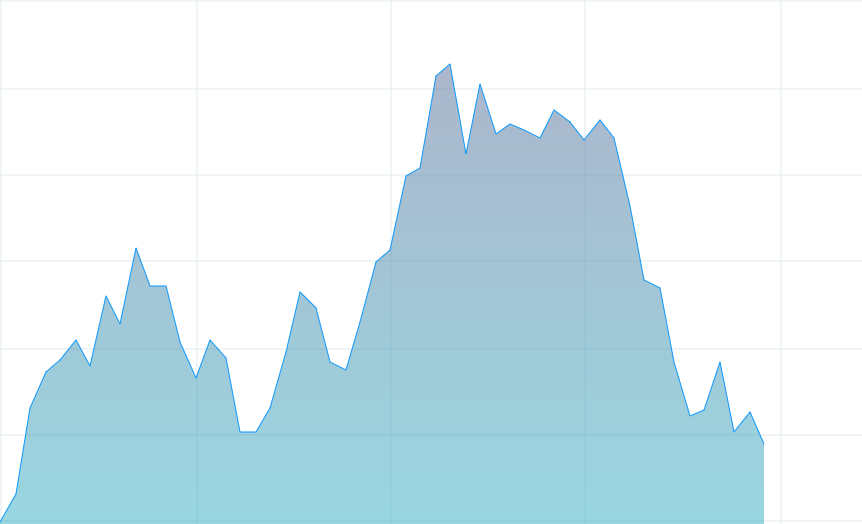
Zone
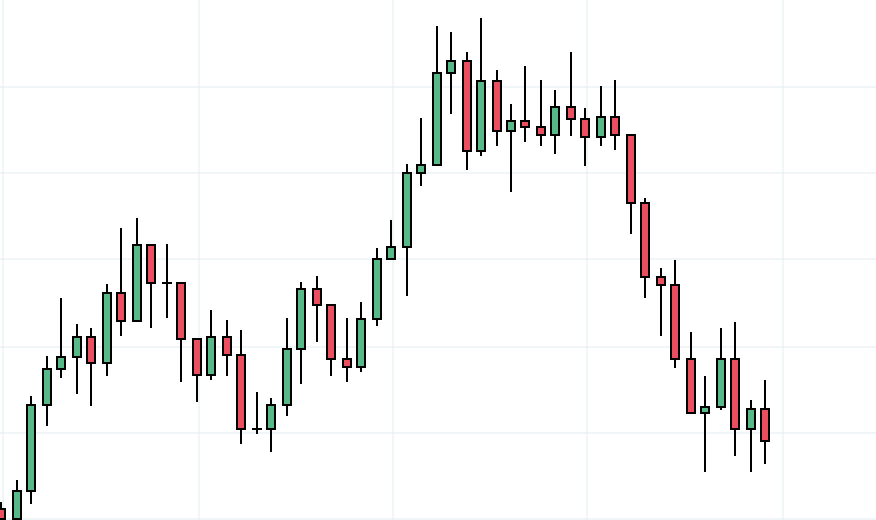
Candlestick
The basic elements of the candlestick chart
A candlestick gives us four price levels at a single glance: high, low, open and close. Between open and close, the candlestick’s “body” indicates market tendencies during this period: a bullish candlestick is conventionally green (close above the open) and a drop candlestick is red (close below the open). With a simple "drawing" we have access to five market elements. A candlestick represents a trading period: if the graph is daily, the candle represents a day. We also notice upper and lower "wicks", these vertical lines that represent the difference between the extreme points and the open or close.
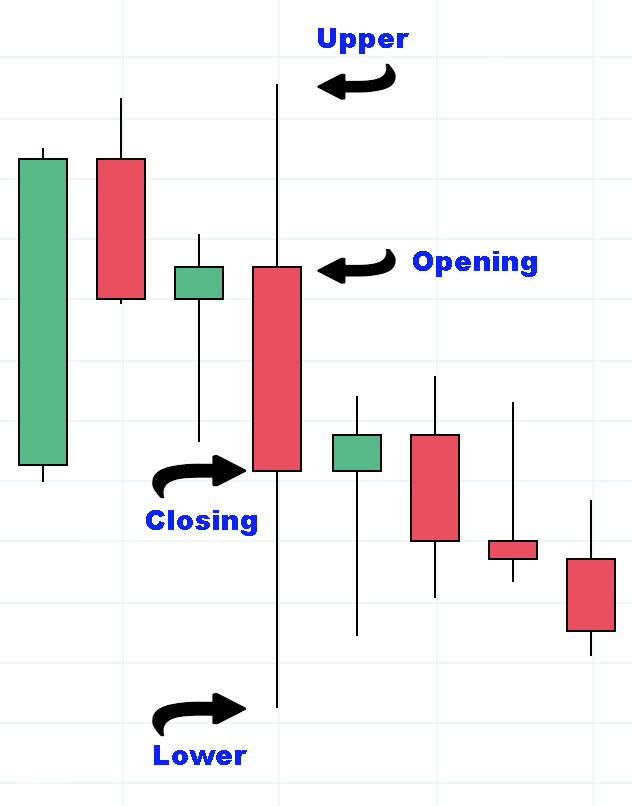
The basic elements of the candlestick chart
Configurations
The purpose of candlesticks does not end there. In fact, their strength is to be able to detect situations or configurations in order to signal future movements, such as trend reversals or accelerations. There are many configurations that bear names like the hammer, the gravestone, tails, wicks and shadows, etc. Each figure can be interpreted in a way that predicts future events.
As usual with trading and graphical analysis, there is no certainty and we must interpret these "signals" with caution. On the other hand, these configurations depend on the time unit of the graph. Thus, a figure on a daily chart will no longer be relevant on an hourly chart. We find this in all technical indicators.
Let's look at two known figures of Japanese candlesticks.
The engulfing candle, which signals a reversal (here bearish):
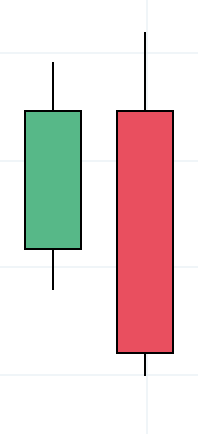
The engulfing candle
Let's see it in action here:
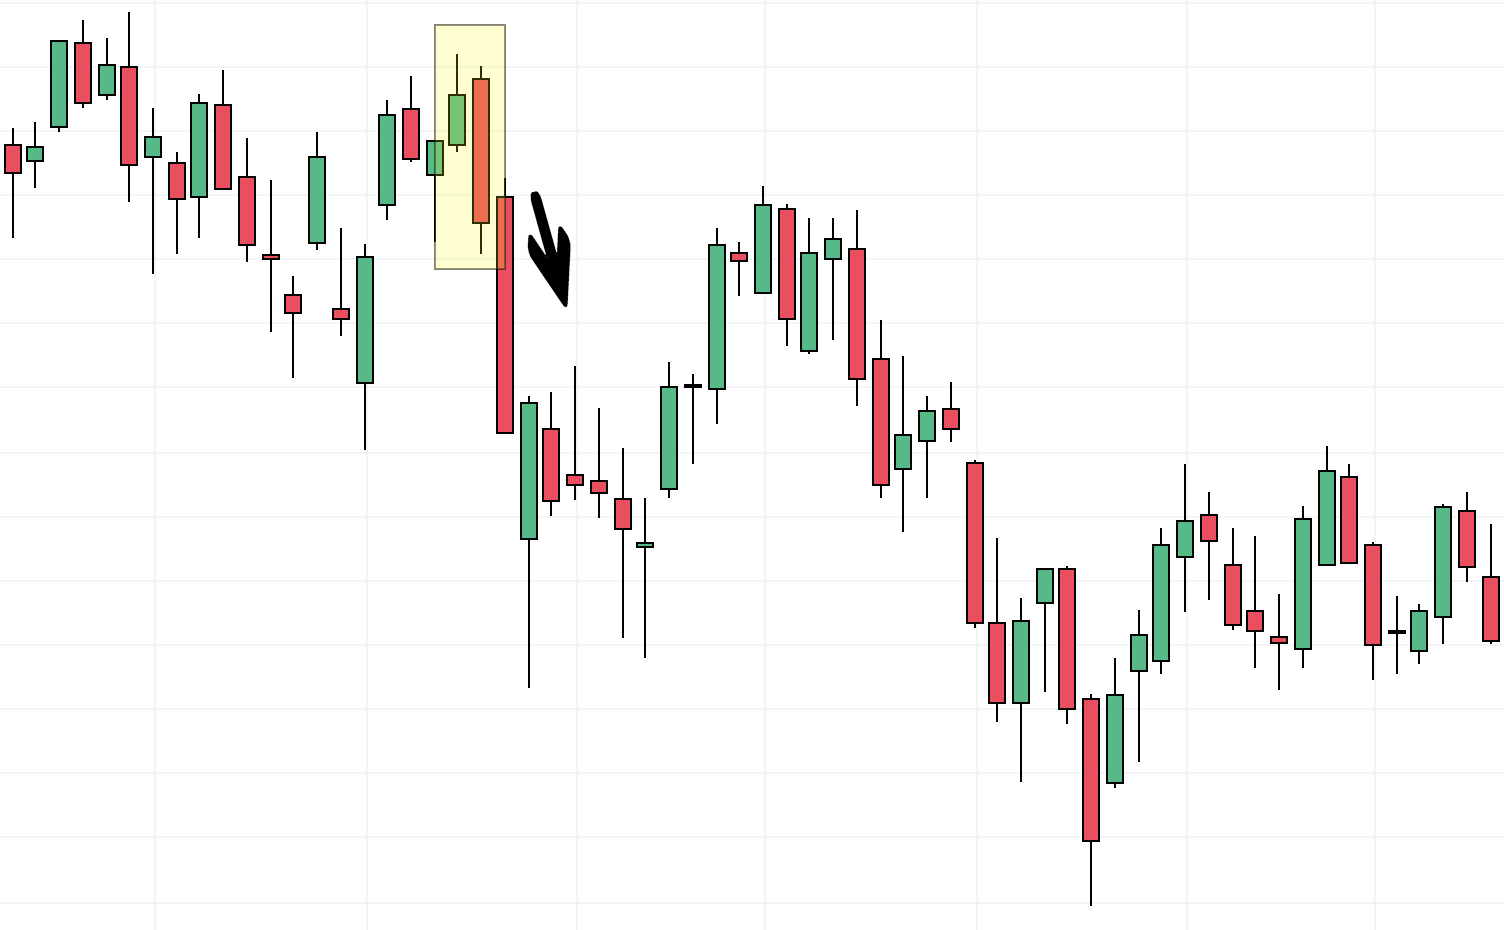
The engulfing candle in action
The Doji, characterised by the absence of body (same level of open and close), is very hard to interpret. It can signal a pause or a reversal of trend. This is what a Doji looks like here in the middle:
This is what a Doji looks like here in the middle:
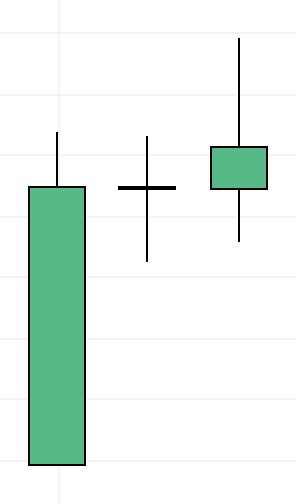
Doji
Here are two dojis in a price evolution:
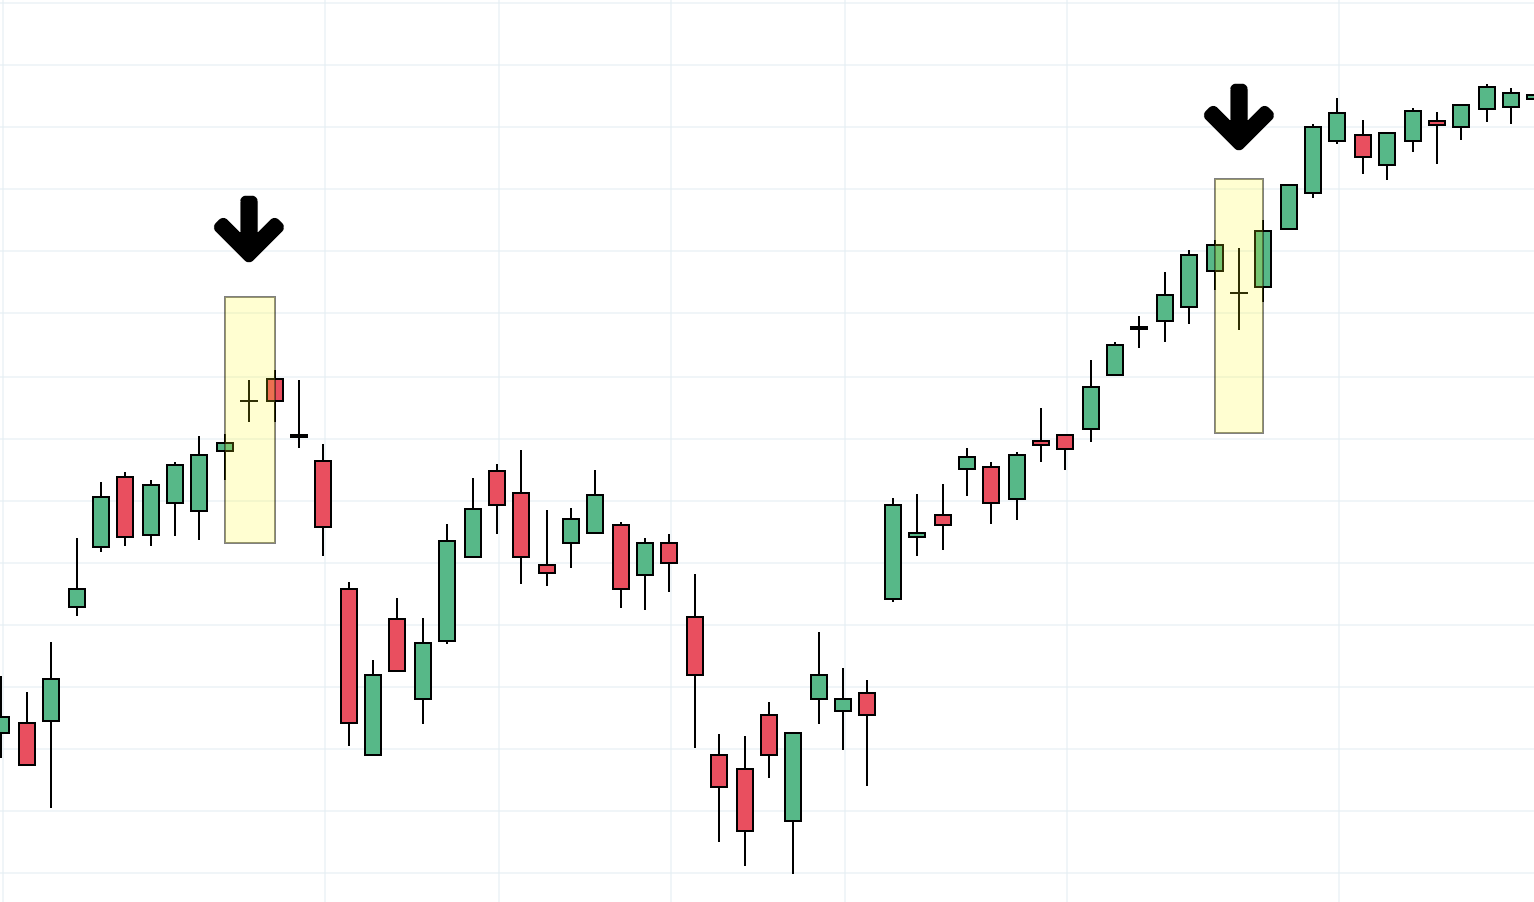
Doji evolution the price
If we wanted to issue a simple strategy for the interpretation of dojis, we could use the following rules: - When the doji is above an uptrend, this is the sign of a bearish turnaround - When the doji is below a downtrend, this is the sign of a bullish turnaround
Volatility
The candlestick’s body and shadows can indicate the volatility of the market. Shadows give us the highest and lowest of the period, an indication of extreme price fluctuations. Meanwhile, the body shows the balance of power between sellers and buyers: a small body (or non-existent body in the case of a doji) is a sign of fierce battle between the bulls and the bears. On the other hand, a clear body in one precise direction gives the victory to one of the two camps.
It is always easy to analyse candlesticks in hindsight and to find figures that announce the movements that follow. However, false signals are numerous. In the heat of the moment it is very difficult to act and trade candlesticks successfully in the long run. But each market is different, and this should not be overlooked. The interpretation of candlesticks may be different depending on whether one is in the stock market, currencies, commodities, etc. Finally, like any graphical analysis, the period used will determine different candlestick patterns and contrary signals sometimes.


